Information
Authors: Zhichao (Charlie) Li and B. Lynn Ferguson, Valentin Nemkov, Robert Goldstein and John Jackowski, Greg Fett
Location/Venue: ASM HTS 13 Indianapolis, IN
Topic: Stress Evolution
Abstract
Computer simulation is used to predict the residual stresses and distortion of a full-float truck axle that has been induction scan hardened. Flux2D® is used to model the electromagnetic behavior and the power distributions inside the axle in terms of time. The power distributions are imported and mapped into DANTE® model for thermal, phase transformation and stress analysis. The truck axle has three main geometrical regions: the flange/fillet, the shaft, and the spline. Both induction heating and spray quenching processes have significant effect on the quenching results: distortion and residual stress distributions. In this study, the effects of spray quenching severity on residual stresses and distortion are investigated using modeling. The spray quenching rate can be adjusted by spray nozzle design, ratio of polymer solution and quenchant flow rate. Different quenching rates are modeled by assigning different heat transfer coefficients as thermal boundary conditions during spray quenching. In this paper, three heat transfer coefficients, 5K, 12K, and 25K W/(m2·C) are applied with keeping all other conditions same. With the understanding of effects of heating and quenching on residual stresses and distortion of induction hardened parts, the induction hardening process can be optimized for improved part performance.
Introduction
It is well known that changes in thermal distributions throughout an induction hardening process create complicated phase transformation and stress evolutions in the component. Both residual stresses and mechanical properties of hardened pattern have significant impact on service performance of the heated treated parts. The induction hardening of steel components is a highly nonlinear transient process and the changes in stress state due to the hardening process are not intuitively understandable in general. With the development of FEA modeling capability in the past decades, both electro-magnetic and thermal stress analyses of the induction hardening have become more mature, and they have been successfully applied to understand and solve industrial problems [1]. The mechanical properties and residual stresses can be predicted by finite element analysis, which will further be used to analyse the mode and location of fatigue failures [2-5]. The component geometry and process can be also optimised to reduce part weight, manufacturing cost, and improve performance.
Induction hardening of steel components is a common processing method due to its fast heating times, high efficiency, and ability to heat locally. However, predicting the final properties of a component after induction processing adds another layer of complexity. Not only temperature and structure have to be considered, but also electromagnetism. When hardening steel, the magnetic properties change throughout the process, affecting the thermal distribution and structure. Coupling these various phenomena to reach the end properties after treatment is a state of the art technology.
A simulation method is developed to use coil design and process settings combined with material and structure to calculate the post-process properties. This stage in the study focuses on the simulation steps needed to produce reliable results. Studies have been successfully accomplished for the development of simulation techniques for the prediction of electromagnetic and thermal effects, coupled with structural changes to predict a hardness pattern [6]. The recent drive is to go a step further for the inclusion of stress levels involved with thermally induced structural 2 changes. This provides a more complete picture of the ultimate material properties. An investigation of stress and distortion modelling of a simple case of ID and OD hardening of a tubular product was previously studied and reported on [7]. It was next desired to perform a study on a component common in industry with a more complex geometry and subjected to external stresses in service. The case chosen for this study is a full-float truck axle with dimensions typical to those manufactured by Dana Corporation. The choice of an axle, a common automotive component, allows for a comparison of simulation results to desired axle properties. The results are discussed in comparison to typical performance criteria for the case chosen. The ultimate goal of this continuous study is to produce results representative of actual part performance.
Descriptions of Axle Geometry, FEA Model and Heat Treatment Process
Truck Axle Geometry and FEA Model for Thermal/Stress Analysis
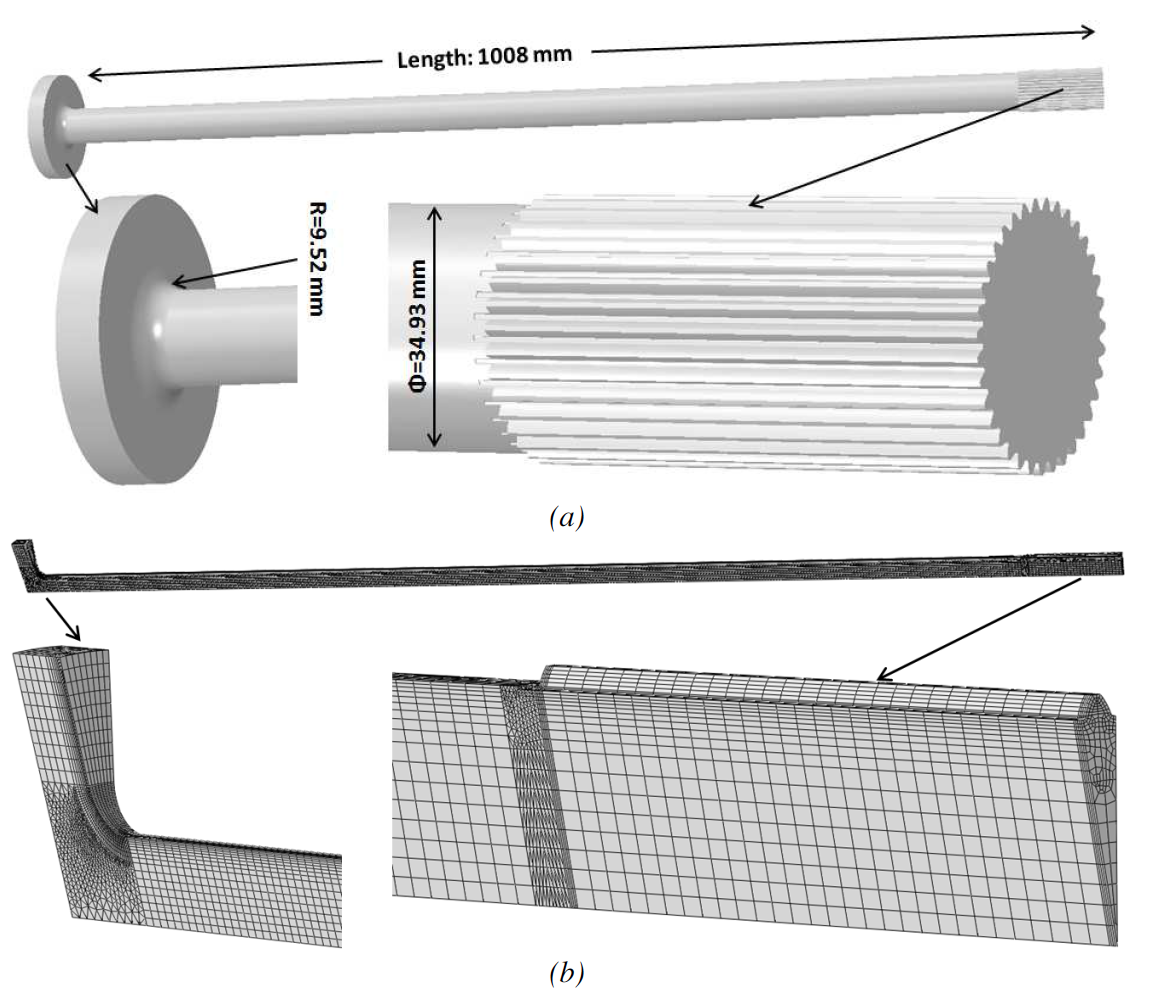
Axles must be surface hardened for durability to prevent failure in service. The hardening process is commonly performed by induction scanning. How the induction scan process is performed affects the induced stresses and distortion. During induction hardening of truck axles with shaft lengths over 1 meter, the main concerns are the bowing distortion and the amount of growth in length. The bowing distortion can be minimized by proper inductor design, high quality process controls and structural support mechanisms. Excessive heat internal to the shaft is the main contributor to this problem, which can be evaluated by simulation. Change in length is affected by both heating and cooling rates of the shaft, and this is again a nonlinear process. A full-float truck axle from Dana Corporation is selected in this study. A simplified CAD model is shown in Figure 1(a). The length of the shaft is 1008 mm; the fillet radius between the flange and the shaft is 9.52 mm; and diameter of the shaft is 34.93 mm; the thickness of the flange is 16.5 mm, and its diameter is 104.5 mm; the spline has 35 teeth in total. Figure 1(b) shows the finite element mesh of a single 3D spline tooth used in DANTE for thermal, phase transformation, and stress analyses. Cyclic symmetry boundary condition is used, so the single tooth represents the entire part with the assumption that all the teeth behave the same. Fine surface elements are used to catch the thermal and stress gradients effectively in the surface.
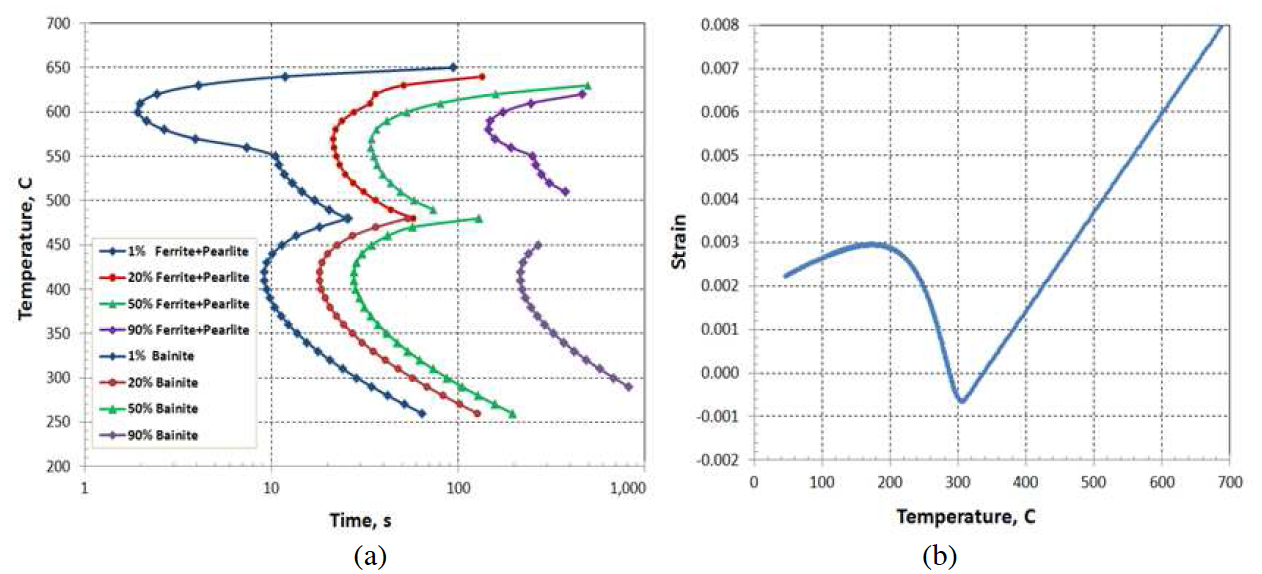
The axle is made of AISI 1541, and the nominal chemical composition is used in this modeling study. Phase transformations are involved in both induction heating and spray quenching processes. During induction heating, the surface of the part transforms to austenite. During spray quenching, the austenite transforms to ferrite, pearlite, bainite, or martensite depending on the cooling rate. Accurate descriptions of phase transformations and mechanical properties of individual phases are required for thermal stress analysis [8]. Figure 2 (a) shows the TTT diagram of AISI 1541 generated from the DANTE database. The TTT diagram is not used by DANTE directly, but the analytical phase transformation models and database contain all the TTT diagram information. Figure 2(b) shows a dilatometry strain curve during martensitic transformation under continuous cooling. This dilatometry strain curve provides the martensitic transformation starting temperature (Ms), martensitic transformation finishing temperature (Mf), transformation strain, and coefficients of thermal expansion (CTE) for both austenite and martensite. Because the cooling rate during induction spray quenching is fast, the martensitic transformation is the main phase transformation type in this case study.
Heat Treatment Process Description
During the scanning induction hardening process, the axle is positioned vertically with the flange on the bottom of the fixture. The distance between the inductor and the spray is 25.4 mm. The process starts with a 9 second static heating period on the flange/fillet. Scanning then begins, with the inductor travel speed of 15 mm/s. After 1.5 seconds of scanning, the scan speed is decreased to 8mm/s and it remains at this speed. The power is turned off after an additional 119.65 seconds; this occurs before the end of shaft is austenitized. Spraying continues after the power of the inductor is turned off to complete the martensitic transformation of the austenitized section of the shaft.
Inductor Design and Modelling of Power Density
It is critical not only to meet the hardened depth requirement, but also prevent excessive heating in regions, such as the flange, the core and end of the shaft. Too much heat in these regions is known to increase the cracking possibility, and may lead to excessive distortion. The minimum case depth requirement for the shaft of this axle is 5.4 mm, and the case depth is defined by 40 HRC.
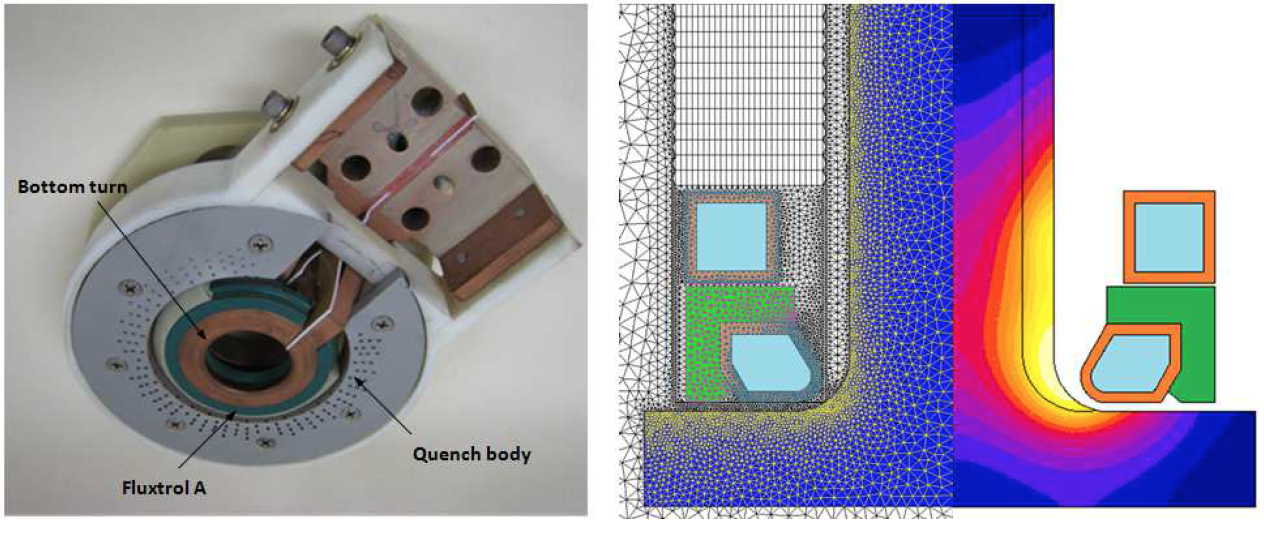
The inductor needs to be designed carefully to prevent cracking and excessive distortion. A machined two-turn coil with magnetic flux concentrator was chosen and configured using Flux2D. An example of a fully assembled coil of this style is displayed in Figure 3(a). The view is from the bottom of the coil. Inductor optimization steps were followed [7]. The bottom turn is profiled to help drive heat in the radius. The profile design is guided by providing the most amount of heat in the radius, while preventing a bulged heating pattern in the base of the shaft or on the flange. Flux concentrator Fluxtrol A® was applied to the bottom turn to further help drive heat into the radius and partially shield flux from coupling with the shaft to prevent a bulged pattern. The top turn is needed to aid in the scan process by widening the heat zone on the shaft. This allows for a faster scan speed. In Figure 3(a), the green material is Fluxtrol A®, surrounded by a grey quench body assembly. A quench body is mounted to the coil, which sprays quenchant about one inch below the coil. The quench is described in Flux2D by a heat transfer coefficient. The quench follows at a location one inch below the coil with the same scanning speed of 8 mm/s. 6% polymer 4 solution is used as the quenchant, and in this paper three quenching rates are studied with the assumed heat transfer coefficients of 5K, 12K, and 25K W/(m2·C) . A finite element meshing used to model the axle by Flux2D is shown in Figure 3(b), with a schematic temperature distribution focusing on the flange and the fillet regions.
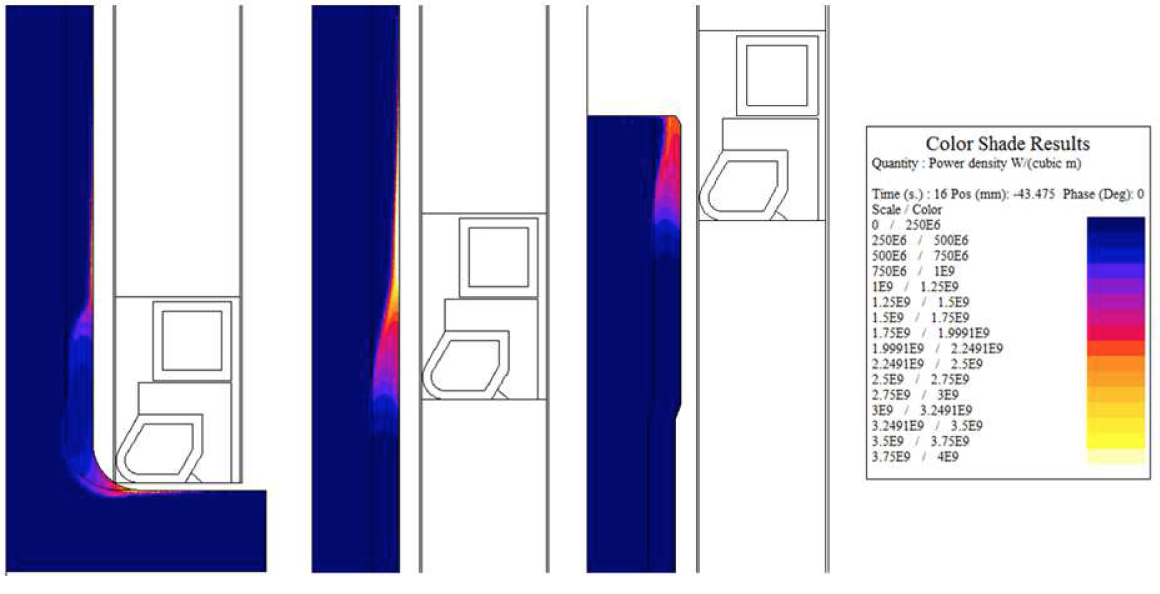
The material of the axle is magnetic, and the power density distribution varies greatly as the temperature exceeds the Curie point. The inductor frequency is 10 kHz, which is the common operating frequency of the Dana induction machines for this class of parts. The difference in skin effect can be seen easily during the scan of the shaft. The portion of the shaft above the bottom turn has high skin effect since it is under the Curie point. The bottom turn provides more intensive heating which drives the case depth and results in a deeper penetration of power at its heat face. Specifically when to turn off power at the end of the process can be calculated in Flux2D by determining the temperature profile as the coil approaches the edge of the spline. Three snapshots of power distribution predicted by Flux2D are shown in Figure 4. In these three snapshots, the inductor delivers power to the flange/fillet, the shaft, and the spline, respectively.
Power Density Mapping from Flux2D to DANTE
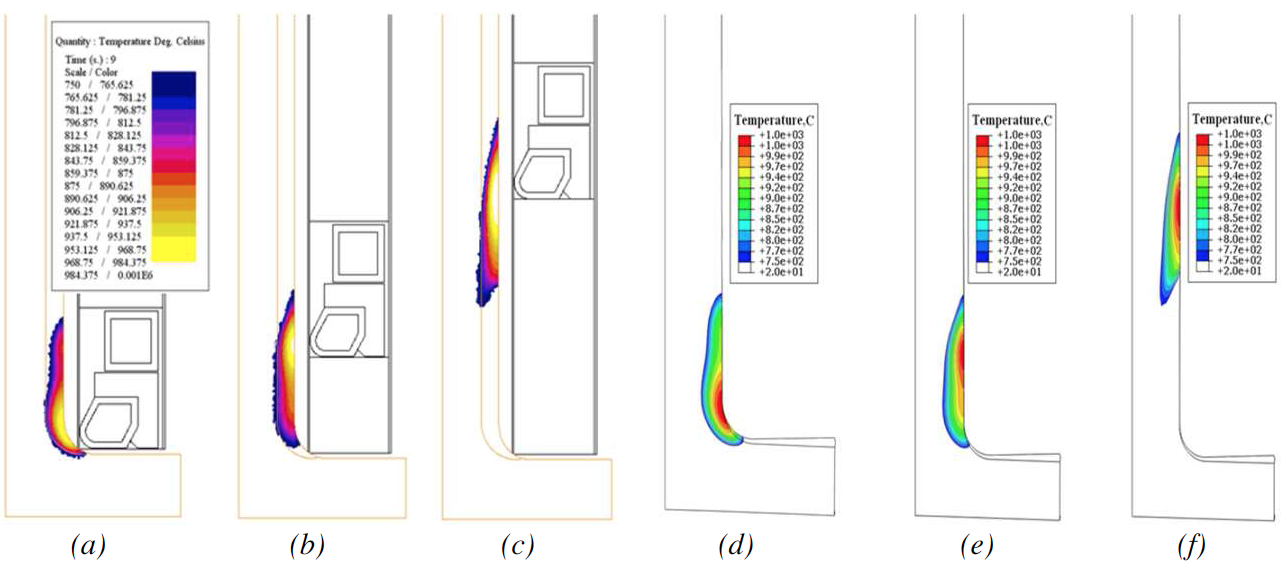
Different finite element meshes are used for Flux2D and DANTE models due to different physics and accuracy requirements. A 3D finite element mesh of a single spline tooth is used in DANTE for thermal, phase transformation, and stress analyses. Fine surface elements are used to model the thermal and stress gradients effectively near the surface. The power densities in the axle predicted by Flux2D are imported and mapped into 5 DANTE. The mapping process is implemented at every 0.5 second time interval, and the power between two power snapshots is linearly interpolated. The temperature distributions predicted by Flux2D and DANTE at various times of the process are compared, as shown in Figure 5, and the predictions from the two packages agree reasonably. The effect of spray quench severity on the temperature distribution under the inductor is insignificant.
Stress and Phase Transformation Modeling using DANTE
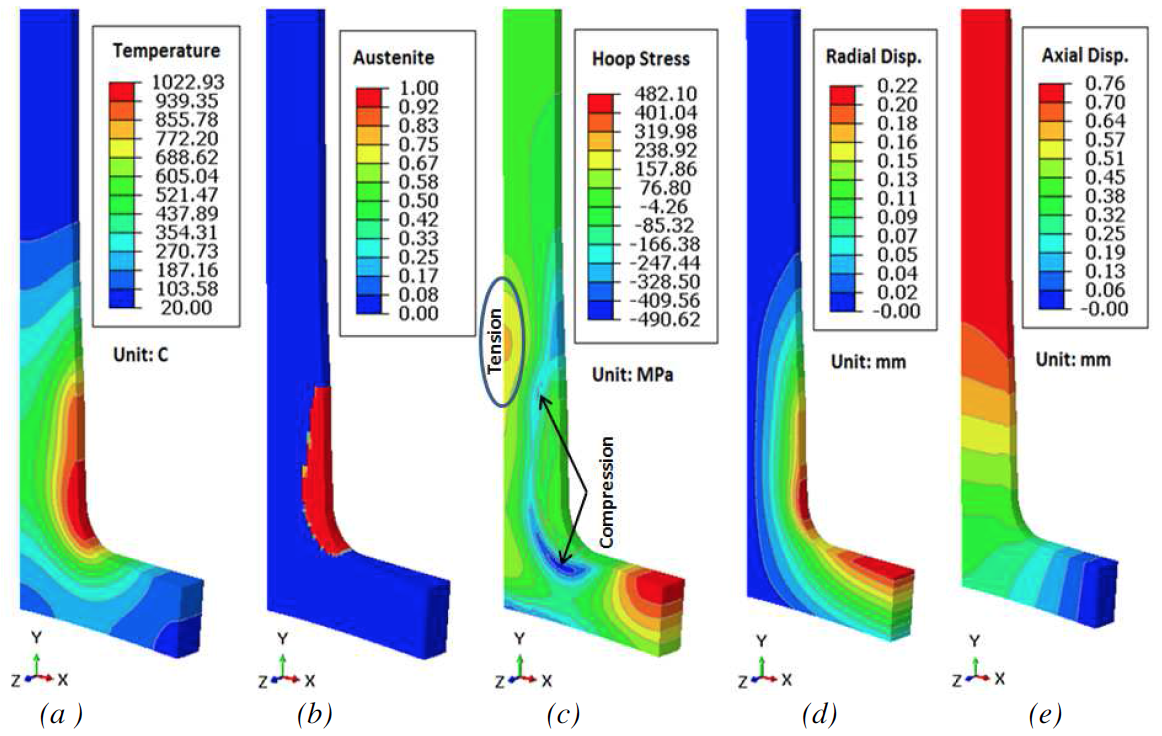
The first step of the induction hardening process is a 9 second dwell allowing the heat to build in the flange/fillet region. In this step, the inductor is stationary with no spray quenching. The temperature and austenite distributions at the end of this step are shown in Figures 6(a) and 6(b). Because austenite has low strength at elevated temperature, the hoop stress in the austenitized region is low. Due to the thermal expansion, the region below the austenitized layer is under compression, and the center above the austenite zone is in tension as shown in Figure 6(c). In this model, the bottom of the OD flange is constrained in the axial direction to avoid rigid shifting, and the shaft expands axially as the axle is heated.
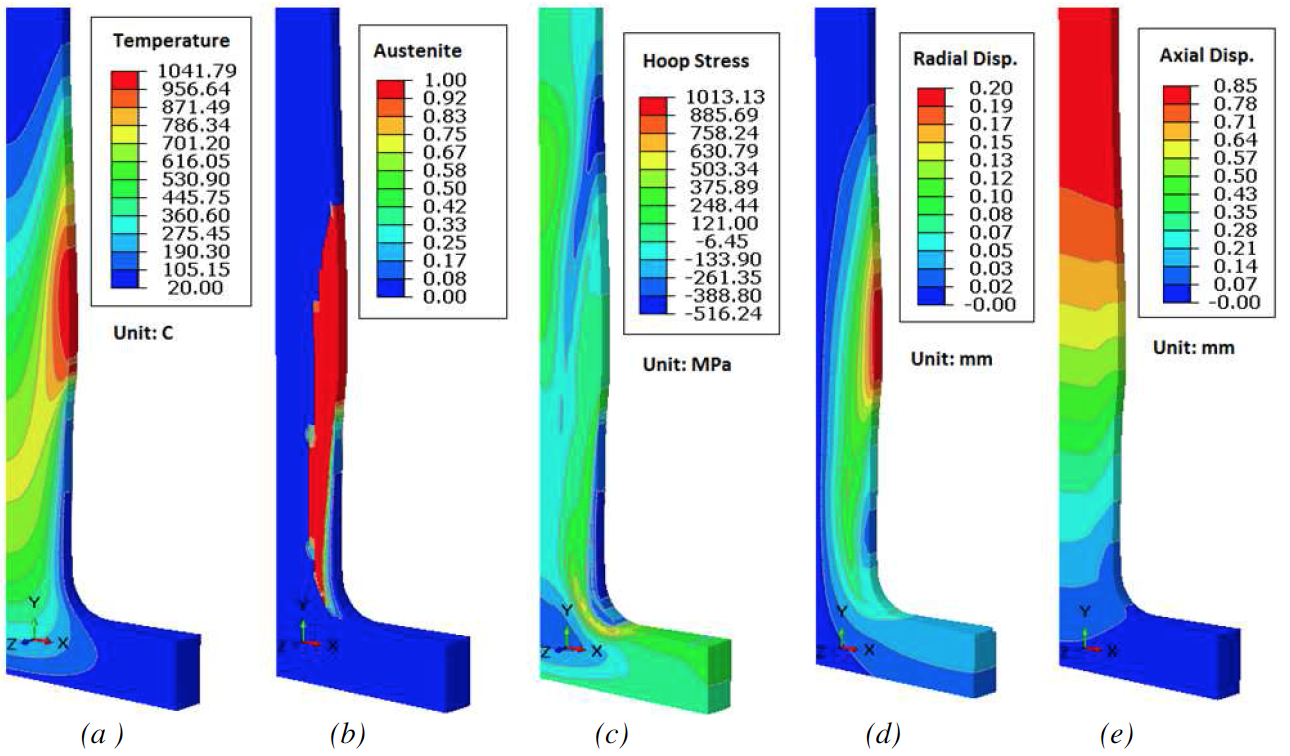
At the end of the first step of 9 second dwell heating, the inductor moves up with a speed of 15 mm/s for 1.5 seconds. Then the speed drops down to 8mm/s and spray quench starts; spraying continues for the duration of the process. The power and temperature distributions are stable during scanning over most of the shaft length. Figure 7 is a snapshot of temperature, austenite, hoop stress, radial and axial displacements at 16.5 second during induction hardening process using 25K W/(m2·C) heat transfer coefficient as boundary condition. During spraying quenching, the austenite layer transforms to martensite with the spray. Figure 7(c) is a snapshot of an in-process hoop stress distribution, which intuitively shows the effect of thermal gradient and phase transformation. The displacement in Figure 7 is magnified 10 times, so shape change can be clearly viewed.
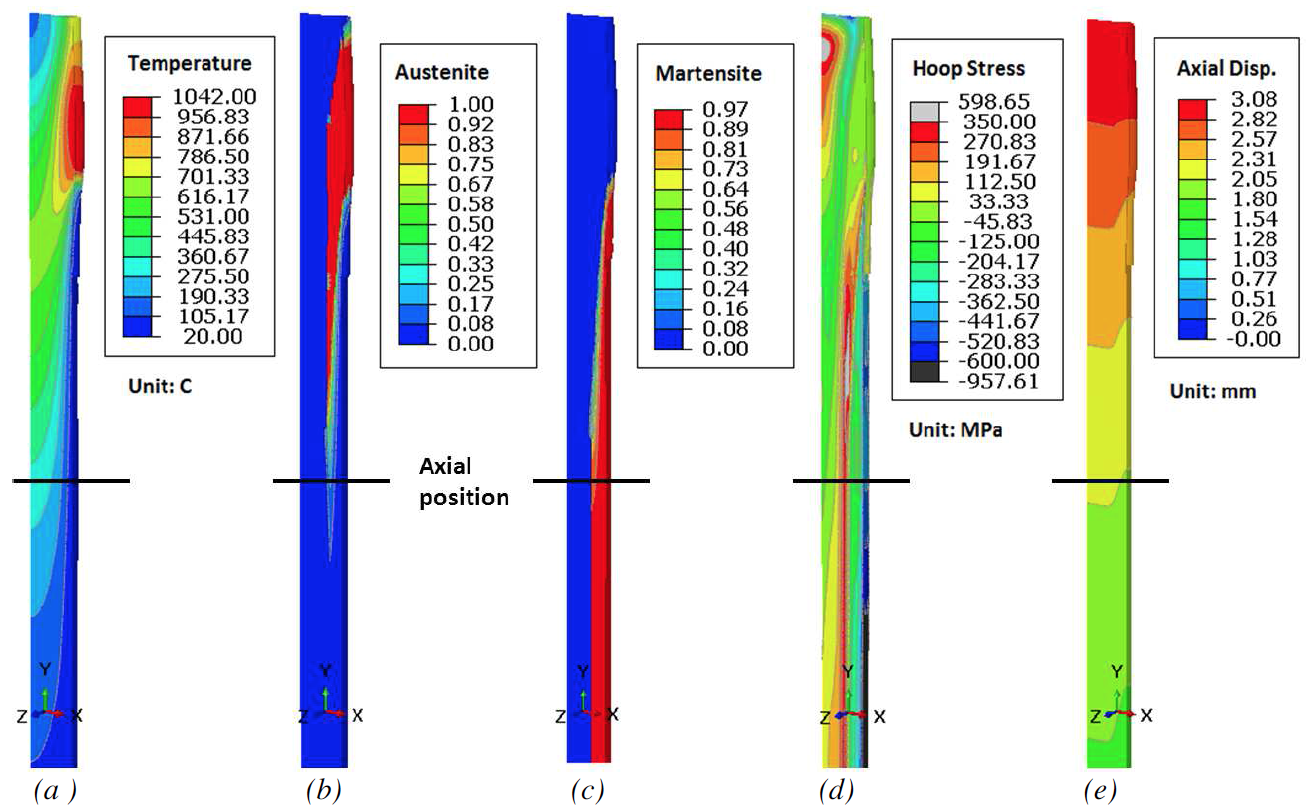
The same power of inductor is applied to the spline region, and the power is turned off after 130.15 seconds of total process time before the end of the spline section is austenitized, as shown in Figure 8. During the scanning process of the spline, the highest predicted temperature is about 1040° C, locating at the tip of the spline tooth. A ductile end is preferred to avoid potential cracks during assembly and service. Once the inductor is turned off, the heat conducts from the OD to the core, but there is not enough heat to increase the depth of the austenite layer. Using the axial position as shown in Figure 8 as an example, the transformation from austenite to martensite is about completed, and compressive residual stresses are developed in the hardened layer due to the volume expansion along with martensitic transformation. The core at this axial position is still warm, with a temperature around 300° C, and further cooling of the core increases the magnitude of surface compression on the surface of the shaft. Figure 8(e) shows the in-process axial displacement distribution. At the lowest axial position in Figure 8, the temperature drops to room temperature, so the axial displacement below it is permanent distortion. The spline will go through cooling and martensite transformation process before reaching to room temperature and the axial displacement of the whole axle will decrease from the current snapshot.
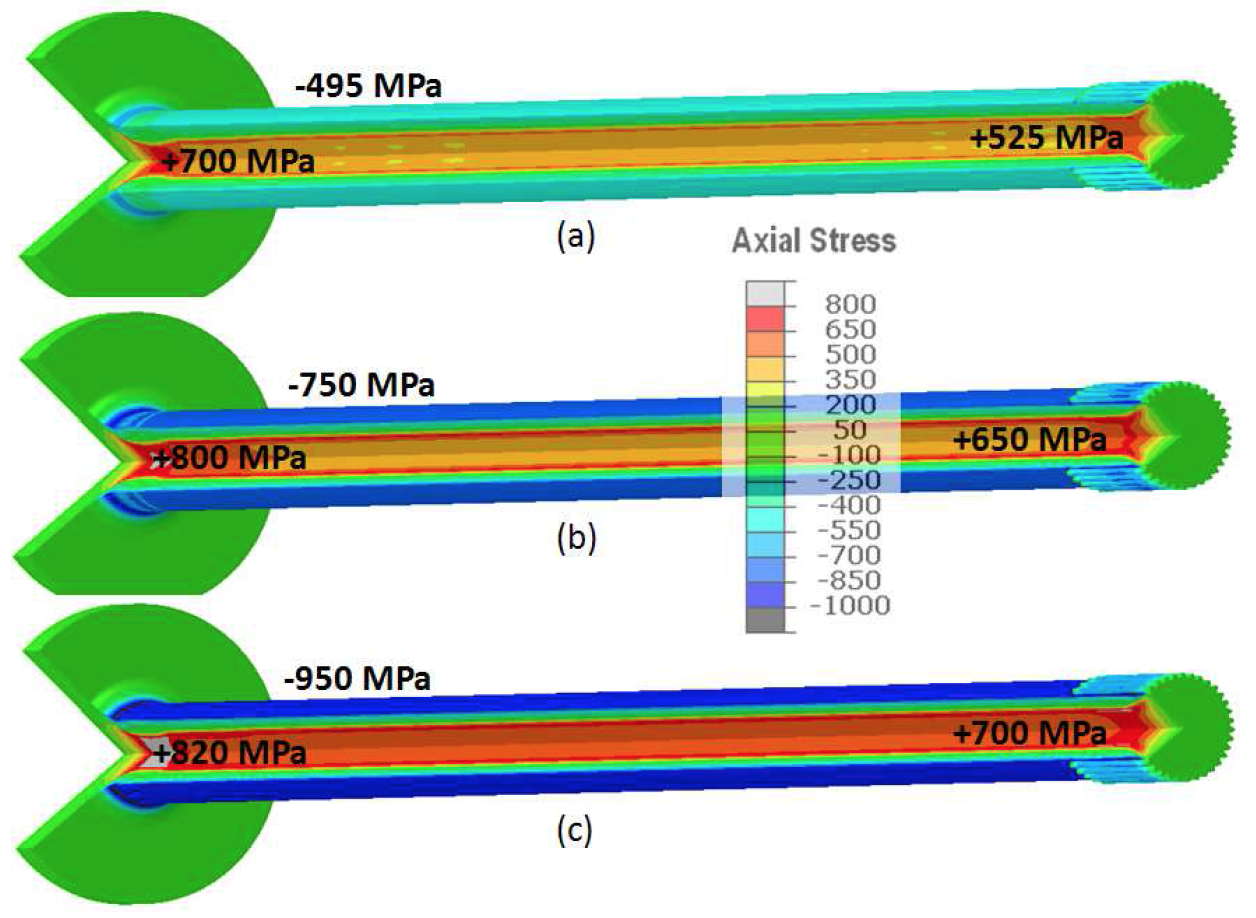
The cooling rate has significant effect on residual stresses in the part. Figure 9 shows the axial residual stresses predicted using the three cooling rates with heat transfer coefficients of 5K, 12K, and 25K W/(m2·C), respectively. Higher cooling rate generates higher residual compression on the surface. To balance the surface stress, the core also shows higher tension. The highest tensile stress in the axial direction is located at the centerline of the shaft above the flange, which is mainly due to the extra heat required to harden the fillet.
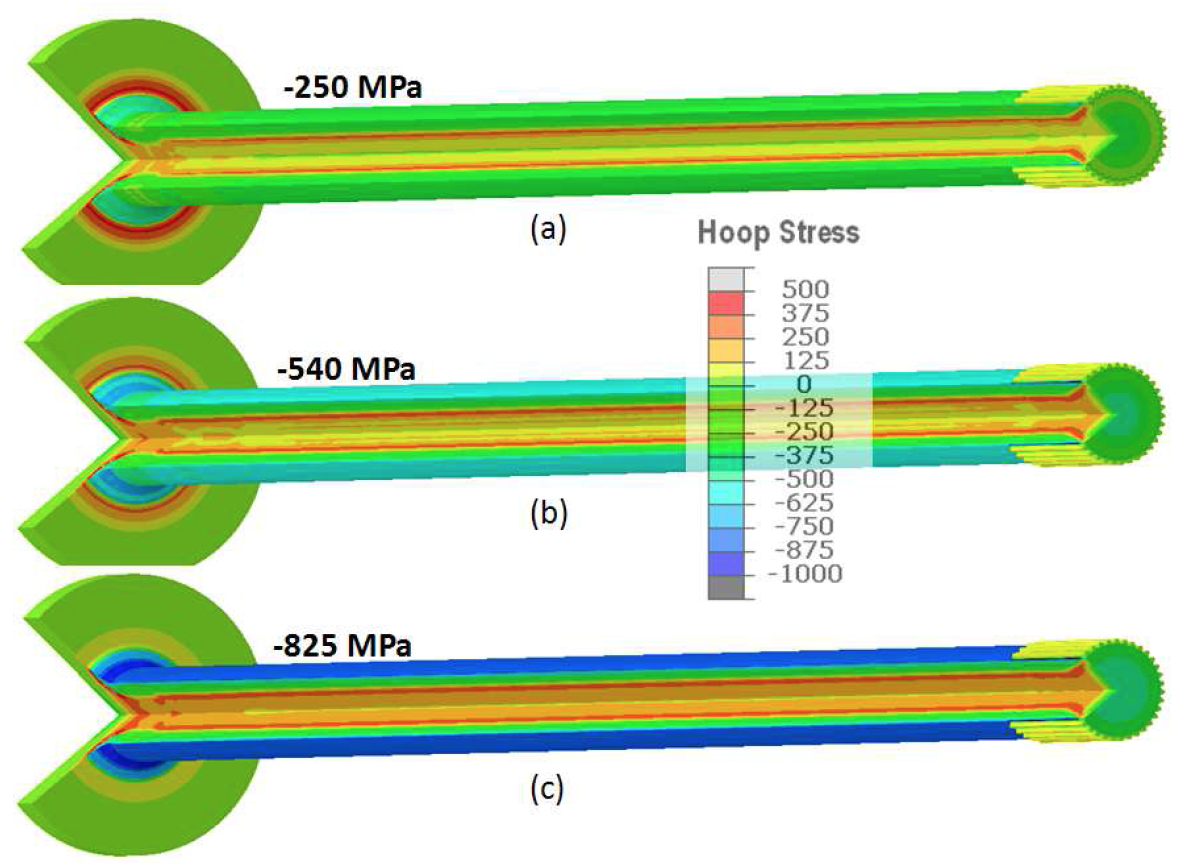
The predicted hoop stresses from the three different cooling rates are shown in Figure 10. With 5K W/(m2·C) cooling, the obtained residual hoop is -250 MPa in compression. With higher cooling rates, the compressive residual stresses are -540 and -825 MPa, respectively. Higher residual compression in both axial and hoop directions can benefit the fatigue performance of the part. Comparing Figure 9 and 10, the magnitude of axial stresses in the core of the shaft is higher than that of hoop stresses. Therefore, the shaft can have high possibility of cracking in the circumferential direction caused by axial stress. Both induction heating and spray quenching process should be designed carefully to increase the surface compression, but reduce the magnitude of tensile residual stresses in the critical region.
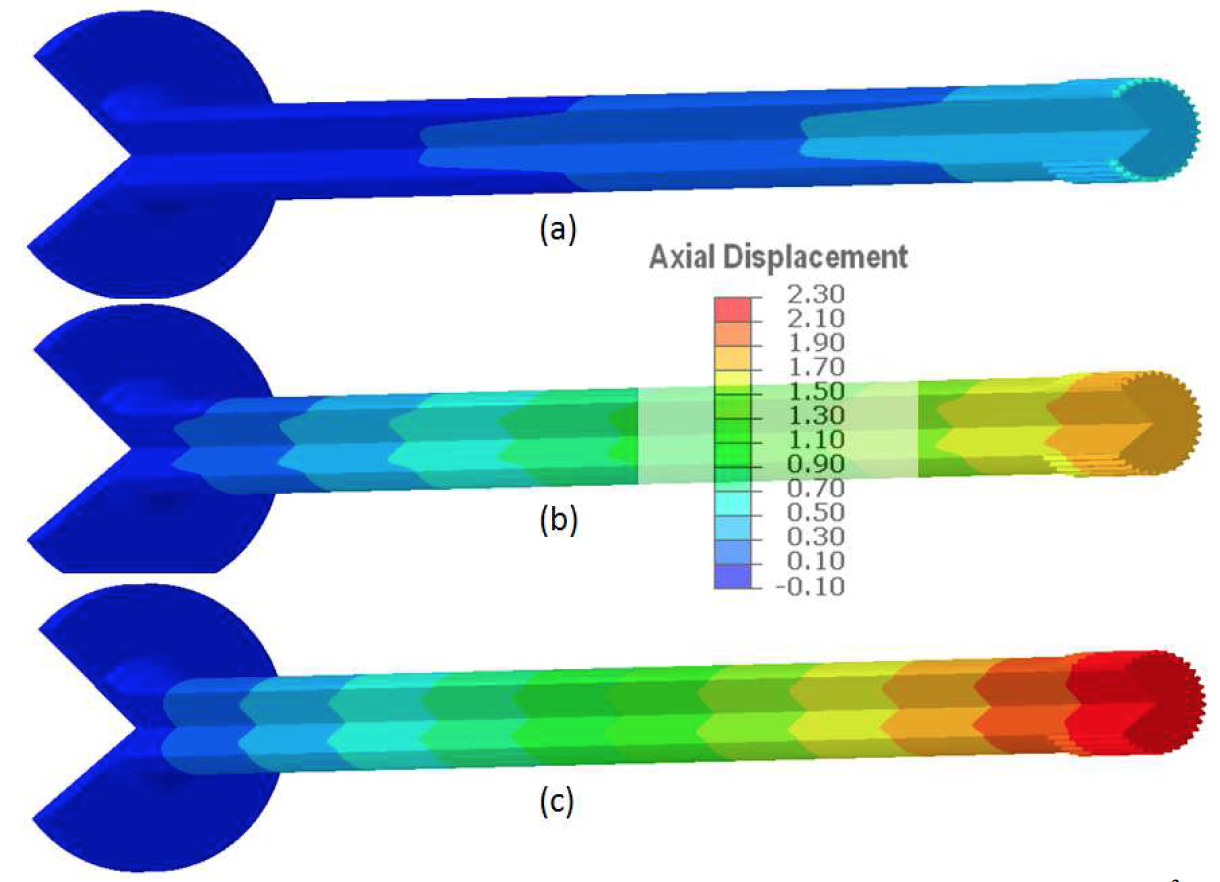
The predicted axial displacements for the three cases are shown in Figure 11. For all the three cases, axial growth is predicted. The same legend is used for the three contours in Figure 11, so the color difference represents the magnitude of axial distortion. The axial displacement in the shaft is not linearly distributed along the axis, which isbecause it is not stabilized during early scanning process of the shaft. The axial displacement from the center to the surface of the shaft varies. Higher cooling rate leads to higher axial growth by comparing the three cases modeled.
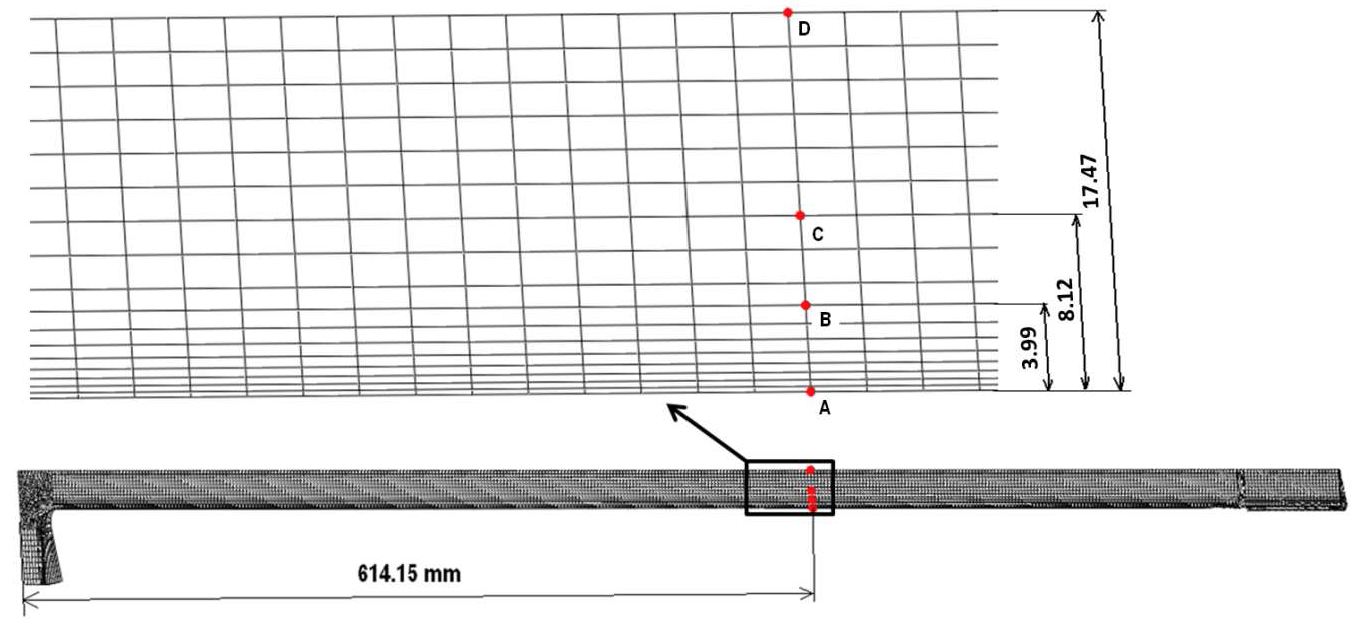
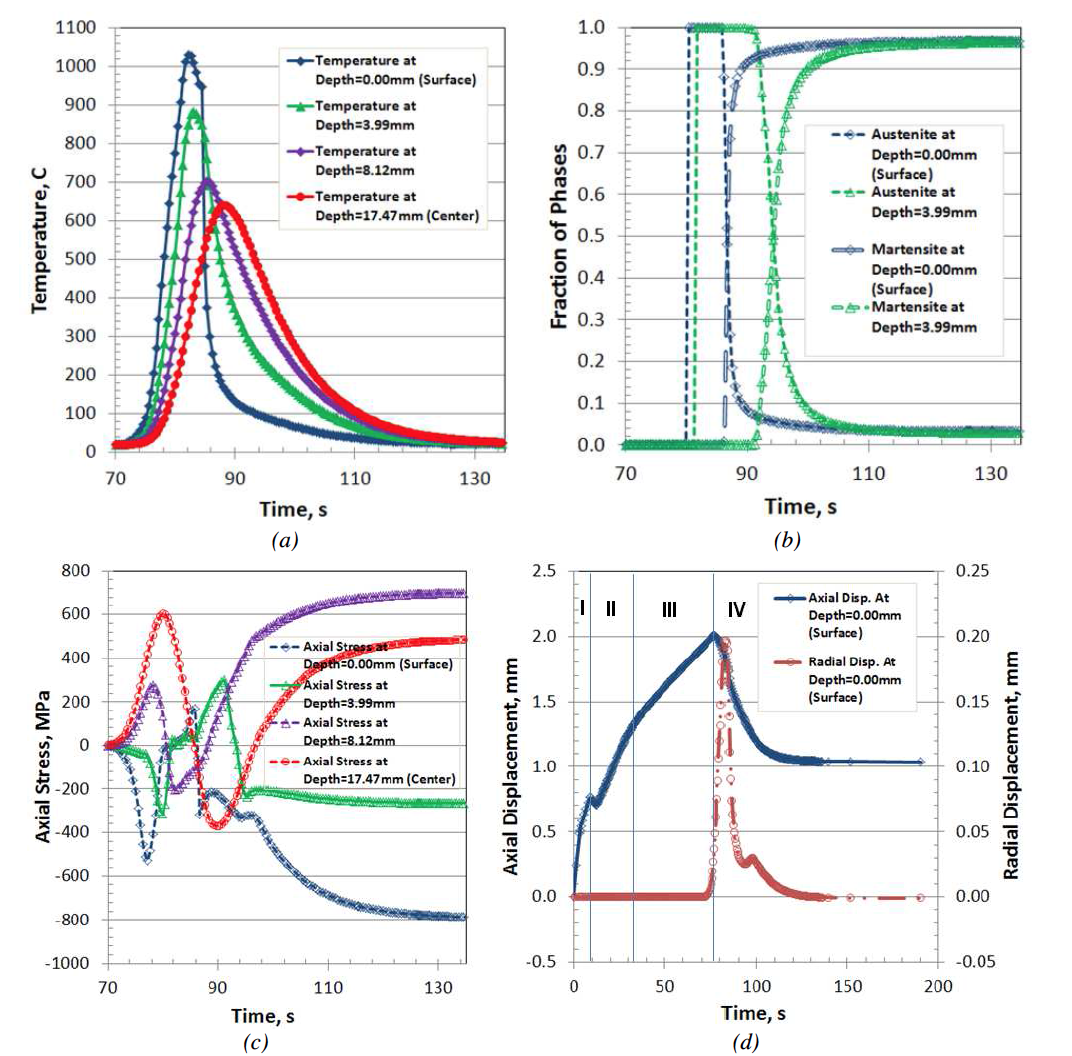
Several points located at different depths from the shaft surface are selected to study the relations of temperature, phase transformation, stress, and shape change during induction hardening process. The points selected are 614.15 mm from the bottom of the flange, as shown in Figure 12. The four points selected are 0.0, 3.99, 8.12 and 17.47 mm from the surface, as shown by points A, B, C, and D in Figure 12. The depth of the hardened layer is 6.5 mm. Therefore, Points A and B are inside the case, point C is close to the case-core interface, while point D represents the core of the shaft.
Using 12K W/(m^2·C) heat transfer coefficient as the thermal boundary condition, the temperature, phase transformation, axial stress and displacement at the four selected points during the induction hardening process are shown in Figure 13. The peak temperatures at the four points are 1030, 880, 700, and 652° C, and the corresponding times are 82.2, 82.8, 85.0, and 88.3 second during the process, as shown in Figure 13(a). Points with shallower depth have higher heating and cooling rates. During heating, point A (surface point with depth 0.0 mm) is heated slightly earlier relative to point B (depth 0f 3.99 mm), and austenite is formed about one second earlier than that at point B. However, the cooling rate at point A is much faster than that at point B, and the time difference for forming martensite at the two locations is about 10 seconds. The thermal gradient and phase transformation are the main driving forces for stress evolution. During the scan heating process and before the surface is austenitized, compressive stresses are created at the surface (points A and B) due to thermal expansion of the surface and constraint by the core material. The magnitude of compression is -530 MPa at point A, which is higher than -310 MPa at point B. To balance the surface compression, points C and D are under tension with peak stress magnitudes of 265 and 600 MPa, respectively. When the surface is austenitized, the magnitude of surface compression drops close to zero due to a combination of phase change and the low yield strength of austenite. During cooling before the surface forms martensite, the surface is under tension due to thermal contraction. Plastic strain is generated in the austenite layer, which will contribute to distortion and residual stresses of as-quenched axle. The stress reversal from tension to compression at point B is about 10 seconds delayed relative to point A, which matches the martensitic transformations at the two points. With martensite formation at the surface, the core (points C and D) is in tension to balance the stress state. Most martensitic transformation of the austenite layer is completed at 102 second, and the temperatures at the core (point D) and the surface (point A) are about 320° C and 125° C, respectively. With further cooling, the temperature distribution through the cross section is balanced, with increased tension at the core, and higher magnitude of compression at the surface. The axial and radial displacements at surface point A are shown in Figure 13(d). The axial displacement of point A is divided into four zones, and it is affected by what happens below it throughout the entire hardening process. Zone I is the 9 second dwell when the flange and fillet section is heated. In Zone II, point A axial displacement reflects scan heating of the shaft section from the fillet to some location below point A where the temperature profile across the shaft section has not yet stabilized. Both zones I and II are highly nonlinear. In Zone III, the moving temperature profile of the shaft cross section has become stabile, and point A axial displacement is linear. Zone IV covers the scan heating and spray quenching of point A and the associated thermal expansion and contraction and phase transformations that occur in this selected section. The radial displacement at point A is affected by what happens locally only. The effect of temperature change and phase transformation on the radial displacement is shown in Figure 13(d).
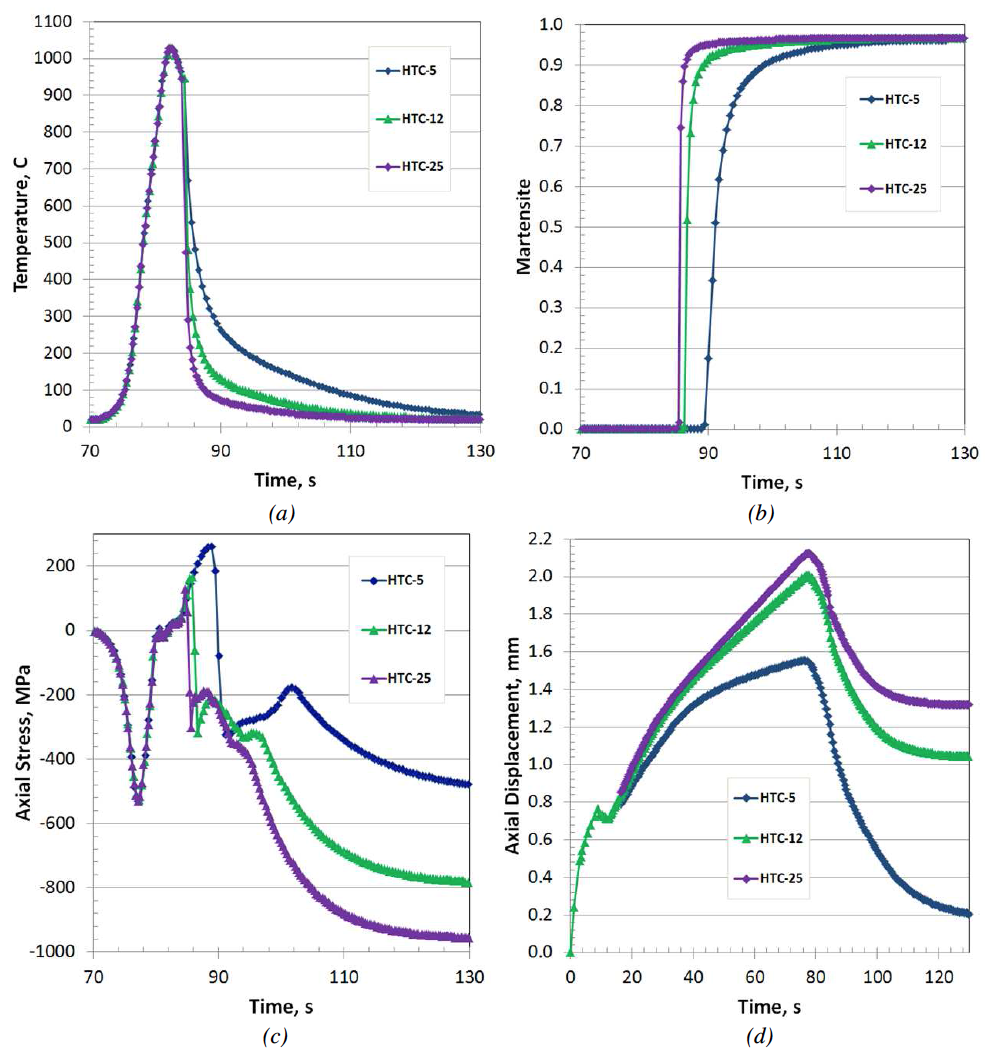
The cooling rate has a significant effect on residual stresses and distortion. The effect of cooling rate on phase transformation, stress evolution and distortion at the surface point A is shown in Figure 14. Figure 14(a) shows the temperature histories at point A with the three cooling rates. Before being quenched, the temperature histories are the same, which means the effect of spray quench on the surface temperature from induction heating is insignificant. The martensitic transformations for the three cases have significant timing difference, as shown in Figure 14(b). The times to form 80% martensite are approximately at 85.7, 87.6, and 93.9 seconds during the process for the highest to lowest cooling rates, respectively. Figure 14(c) shows the evolution of axial stress, and the residual stresses are -450, -780, and -950 MPa, respectively for lowest to highest cooling rates. The axial displacement histories at point A are shown in Figure 14(d), and it is clearly shown the cooling rate has significant effect on the axial growth, with a high cooling rate resulting in greater axial growth than low cooling rate.
Summary
The electromagnetic modelling using Flux2D and thermal-stress modelling using DANTE are successfully coupled in this study. The power mapping process from Flux and DANTE is validated by directly comparing the temperature profiles predicted by the two packages. Three spray quenching rates are modelled in this study with heat transfer coefficients of 5k, 12k, and 25K W/(m2·C). A higher cooling rate creates higher surface compression and higher tension in the core, as well as more axial growth. The induction heating process parameters of frequency, power and scan speed affect the temperature profile, which will significantly affect the residual stress distribution even without changing the case depth. The cooling rate also proved to be significant to the final level of residual stress and distortion. The modelling procedure developed in this study is promising for design optimization, in-process failure prevention, and service property prediction.
References
[1] Goldstein, G., Nemkov, V., Jackowski, J. (2009) Virtual Prototyping of Induction Heat Treating. 25th ASM Heat Treating Society Conference.
[2] Ferguson, B., and Dowling, W., “Predictive Model and Methodology for Heat Treatment Distortion”, NCMS Report #0383RE97, 1997
[3] Warke, V., Sisson, R., and Makhlouf, M., “FEA Model for Predicting the Response of Powder Metallurgy Steel Components to Heat Treatment”, Mater. Sci. Eng., A, 2009, 518(1–2), pp. 7–15
[4] Bammann, D., et al., “Development of a Carburizing and Quenching Simulation Tool: A Material Model for Carburizing Steels Undergoing Phase Transformations”, Proceedings of the 2nd International Conference on Quenching and the Control of Distortion, November (1996), pp. 367-375
[5] Ferguson, B.L., Freborg, A.M., Li, Z., “Probe Design to Charactrize Heat Transfer during Quenching Process”, Proceedings of 6th International Quenching and Control of Distortion Conference, Chicago, Illinois, September 9-13, 2012, pp. 792-801
[6] Nemkov, V., Goldstein, G., Jackowski, J. (2011). Stress and Distortion Evolution During Induction Case Hardening of Tube. 26th ASM Heat Treating Society Conference.
[7] Goldstein, R., Nemkov, V., Madeira, R., (2007). Optimizing Axle-Scan Hardening Inductors. Industrial Heating, December 2007.
[8] Li, Z., Ferguson, B., and Freborg, A., “Data Needs for Modeling Heat Treatment of Steel Parts”, Proceedings of Materials Science & Technology Conference, 2004, pp. 219-226
If you have more questions, require service or just need general information, we are here to help.
Our knowledgeable Customer Service team is available during business hours to answer your questions in regard to Fluxtrol product, pricing, ordering and other information. If you have technical questions about induction heating, material properties, our engineering and educational services, please contact our experts by phone, e-mail or mail.
Fluxtrol Inc.
1388 Atlantic Boulevard,
Auburn Hills, MI 48326
Telephone: +1-800-224-5522
Outside USA: 1-248-393-2000
FAX: +1-248-393-0277
Related Topics
- Effect of Spray Quenching Rate on Distortion and Residual Stresses during Induction Hardening of a Full-Float Truck Axle
- Effect of Steel Hardenability on Stress Formation in an Induction Hardened Axle Shaft
- Modeling Stress and Distortion of Full-Float Truck Axle During Induction Hardening Process
- Stress and Distortion Evolution During Induction Case Hardening of Tube