Toll Free


Information
Authors: Kreter, Goldstein, Yakey, Nemkov
Location/Venue: ASM HTS 13 Indianapolis, IN
Topic: Thermal Effects on Inductor
Abstract
In induction hardening, thermal fatigue is one of the main failure modes of induction heating coils. There have been papers published that describe this failure mode and others that describe some good design practices [1-3]. The variables previously identified as the sources of thermal fatigue include radiation from the part surface, frequency, current, concentrator losses, water pressure and coil wall thickness. However, there is very little quantitative data on the factors that influence thermal fatigue in induction coils available in the public domain. By using finite element analysis software this study analyzes the effect of common design variables of inductor cooling, and quantifies the relative importance of these variables. A comprehensive case study for a single shot induction coil with Fluxtrol A concentrator applied is used for the analysis. Figure 1 shows the 2D plane analyzed using Flux 2D.
Introduction
In induction hardening, thermal fatigue is one of the main failure modes of induction heating coils. There have been papers published that describe this failure mode and others that describe some good design practices [1-3]. The variables previously identified as the sources of thermal fatigue include radiation from the part surface, frequency, current, concentrator losses, water pressure and coil wall thickness. However, there is very little quantitative data on the factors that influence thermal fatigue in induction coils available in the public domain. By using finite element analysis software this study analyzes the effect of common design variables of inductor cooling, and quantifies the relative importance of these variables. A comprehensive case study for a single shot induction coil with Fluxtrol A concentrator applied is used for the analysis. Figure 1 shows the 2D plane analyzed using Flux 2D.
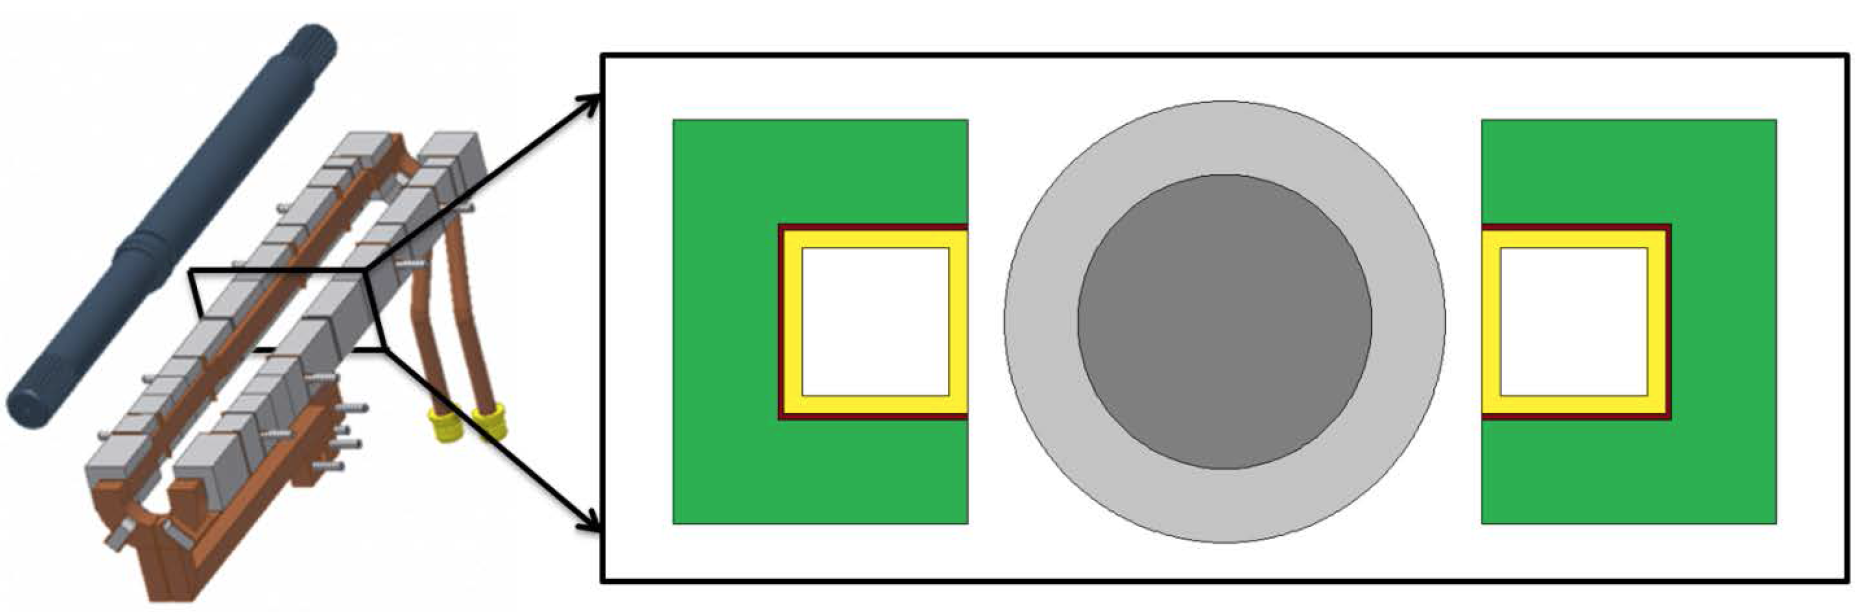
Figure 1: 2D Plane Simulated in a Single Shot Induction Coil.
Simulations were made with varying frequency, coil wall thickness, current, and cooling water pressure. Table 1, lists the values of these variables used in the study. A model was made for all combinations of them. Transient electromagnetic and thermal coupled models were made for 10 seconds of heating. In select cases, cycling of power being turned on and off was also simulated.
Table 1. Variables Used in Flux 2D Simulation
| Frequency (kHz) | Current (A) | Cooling Water Pressure (psi) | Coil Wall Thickness (in) |
|---|---|---|---|
| 1 | 5000 | 20 | 0.048 |
| 3 | 7500 | 40 | 0.062 |
| 0 | 10000 | – | 0.125 |
A few assumptions were made in the models. The heat transfer coefficients were calculated using correlations for flow inside of a 5/8” square tube, 36” long with two different water pressures at constant temperature. In reality they will slightly change with temperature, but this assumption was made to simplify the analysis. In some of the models the inductor would have likely failed when the inner surface of the inductor reached over 250°C. When this temperature is exceeded, there is a risk of a vapor layer forming that would dramatically drop the heat transfer coefficient leading to further temperature rise resulting in copper failure. For this reason, these cases were dropped from analysis in the study. While a thermal model was made on the inductor, the steel is simulated at constant temperature. It is assumed to be already at the target temperature. The outer layer of the part is set to 800°C and made non-magnetic, since it is above the Curie point. Figure 2 details the dimensions and materials that make up the model. JB Weld is applied as the glue between the copper and Fluxtrol A concentrator. It has a thermal conductivity of 1 W/m*K. Magnetic losses in the Fluxtrol A concentrator are calculated in the thermal model.

Figure 2: Dimensions and Materials for the Flux 2D Simulations
Effect of Radiant Heat Transfer on the Inductor Temperature Distribution
Radiation from the hot work piece is often blamed as a significant contributor to overheating of the inductor. To test this, a simulation was made to compare the temperature distribution with and without radiation applied. The case used had 3 kHz, 10,000 A, 40 psi, and 0.125” wall thickness. Radiation from a 1,000°C source for the entire 10 s heating stage was applied to the work piece facing surface of the inductor. A view factor of 1 was assumed, which will significantly overestimate the effect of radiation on the coil and drastically overestimate it on the concentrator. The temperature distributions for the two cases with and without radiation are shown in figure 3.
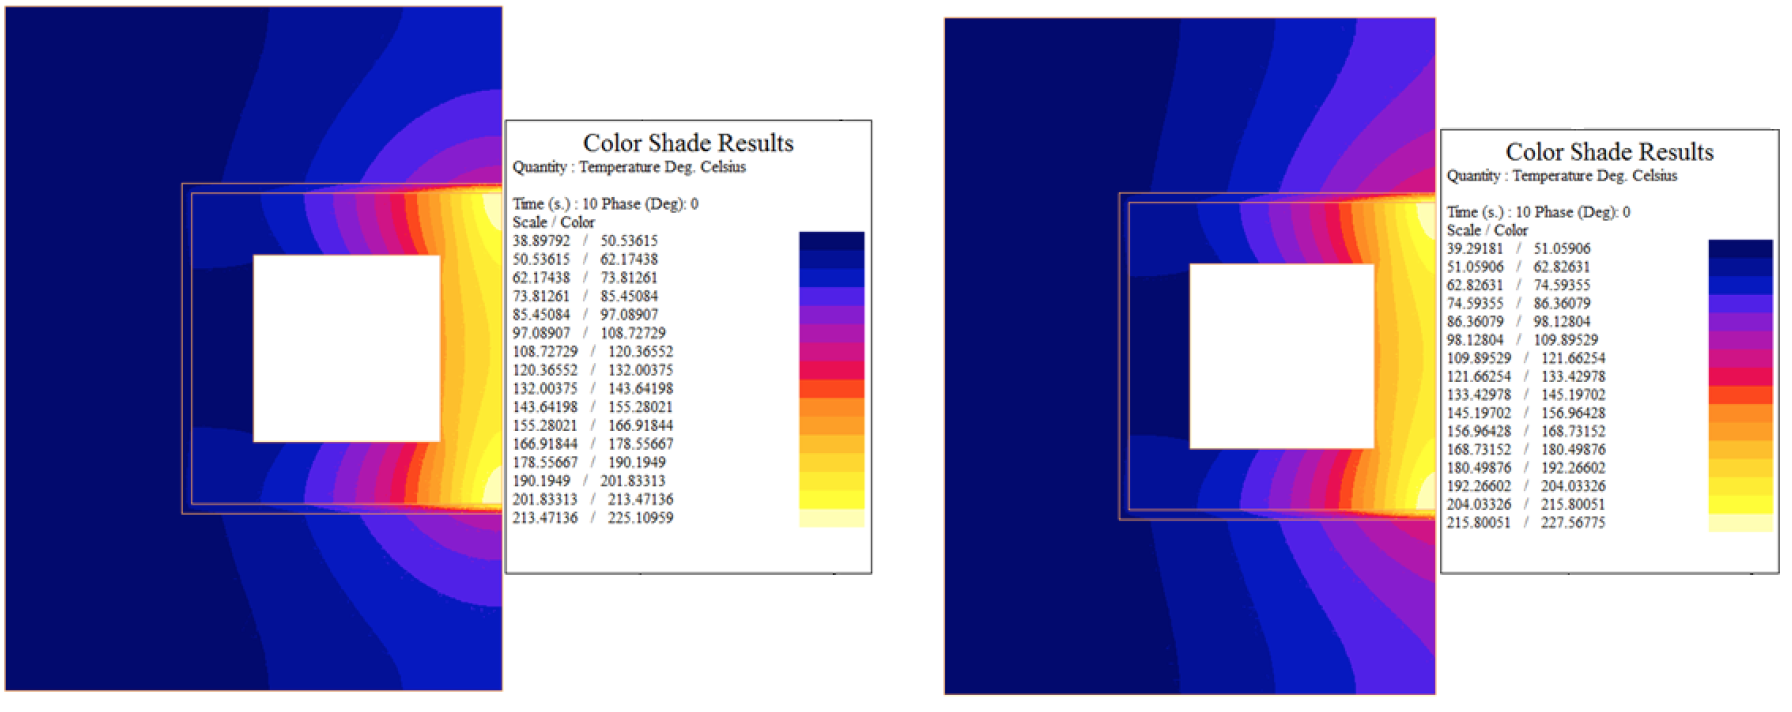
Figure 3: Temperature Distribution without Radiation (Left) and with Radiation (Right)
The results show that when radiation is included in the model the overall maximum temperature only increases by approximately 2°C. The flux concentrator temperature increases 10°C. Based upon the temperature distributions, it can be seen that the main source of heat in the concentrator for this case is conductive heat transfer from the corner of the hot copper tube. Factoring in an overestimated level of radiation has little additional effect. For this reason, radiation was not considered in any of the other models in this paper. For continuous high temperature processes the effect may be more significant and worthy of greater consideration.
Influence of the Reference Depth to Coil Wall Thickness Ratio
The percent of total power lost in the coil is used as an indicator of the efficiency of the coil. This is plotted below in figure 4 at varying frequency, wall thickness, and current. Water pressure is held constant at 40 psi.
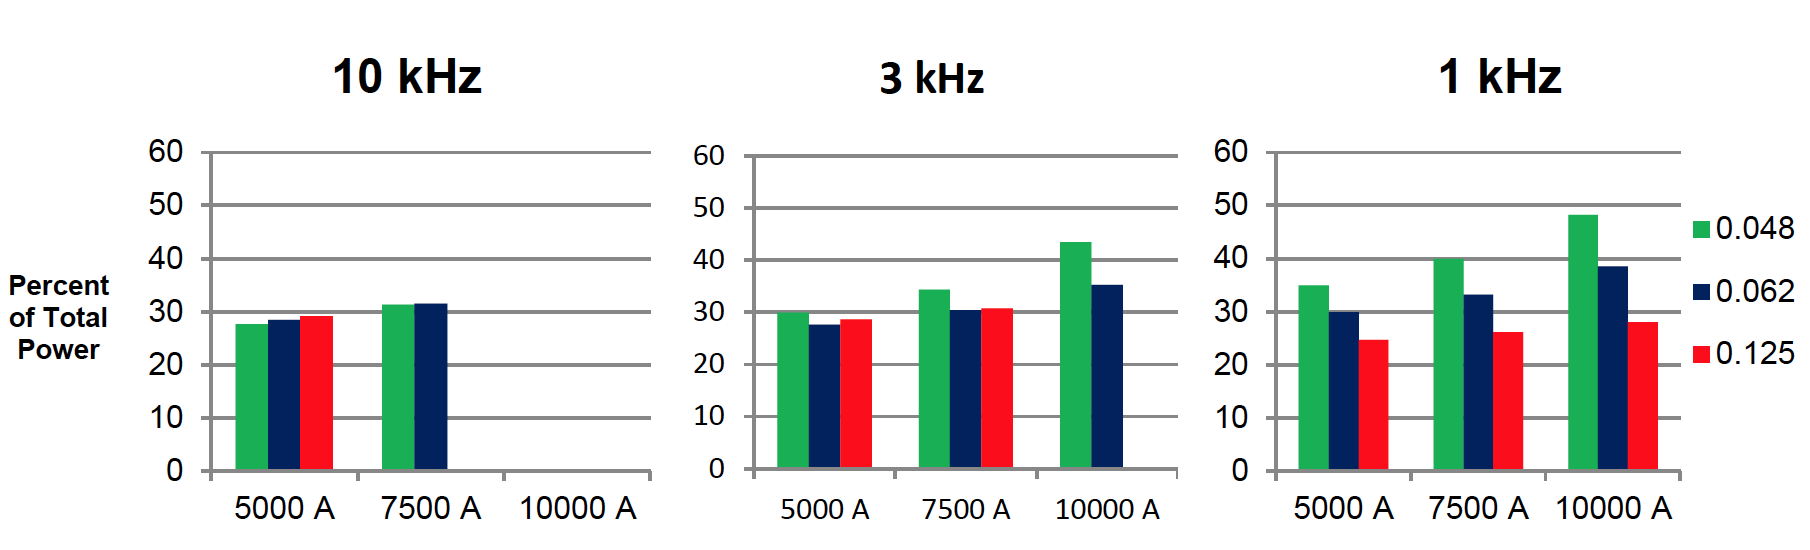
Figure 4: Percent Total Power in Coil for selected cases. Cooling Water is at 40 psi. Cases where the inductor reached greater than 250°C are dropped from the graphs.
There is a correlation between the wall thickness to reference depth ratio and losses in the coil. This is most apparent in the 1 kHz plot. At 1 kHz the reference depth is largest and coil losses strongly correlate to the wall thickness. As the wall thickness increases, coil losses decrease. This effect is not strong for the 3 kHz and 10 kHz cases, since the reference depth is smaller.
The large difference between 1 and 3 kHz is apparent when looking at the color shades for power density (Figure 5). Pictures of all three wall thicknesses are shown at both frequencies. In addition to the wall thickness, the ratio of the wall thickness (t) to the electrical reference depth (δ) is provided in parenthesis. For these cases, the highest local power density value is in the corners and it remains nearly constant for a given frequency and current level. This is due to the fact that in this area, the wall is thick (due to the sidewalls) and the electromagnetic end effect and concentrator effect increase the local power density.
The main difference in these cases is in the heating of the central region of the tube. For 0.048” wall tube at 1 kHz (t/δ = 0.48), the power density in the central region of the tube is constant in thickness and comparable to the maximum values on the surface in the corners. As wall thickness increases, the heating of the central region transitions from volumetric heating to surface heating and a power density gradient in the wall thickness develops. This is also apparent to a lesser extent in the 3 kHz results. For 0.125” wall at 3 kHz (t/δ = 2.5), the distribution is consistent with high skin effect. Since there is almost no power density on the regions of the copper tube near the water channel, one would expect nearly no change in the power density distribution with additional increases in wall thickness.

Figure 5: Power Density within Coils of Varying Wall Thickness at 3 kHz and 1 kHz
To better document the relationship between wall thickness and reference depth on the coil losses, a series of simulations were made for the 3 kHz, 5000 A, 40 psi case. Wall thickness was varied beyond only the three values analyzed previously to generate the plot in figure 6. Power lost in the coil is plotted against the wall thickness to reference depth ratio.

Figure 6: Percent Power Lost in Coil vs. Wall Thickness to Reference Depth Ratio (3 kHz, 5000 A, 40 psi)
The graph shows that when the wall thickness is less than the reference depth, losses in the coil are high. Above 1, the level slowly declines to a minimum value occurring at a ratio around 1.2, where the power density in the central region of the coil is transitioning from volumetric to high skin effect heating. Above 1.2, the level increases slightly and then levels off. Historically, it has been found that losses will be at their minimum when the ratio is 1.6. The 1.6 value was derived for a 1-D system that did not take into account the end effect of the coil, non-uniform proximity effect (round body, rectangular coil), influence of side walls or the concentrator effect. The optimal ratio of wall thickness to reference depth will vary somewhat based upon the specific geometry of the induction coil and component. Based upon these calculations, as long as the ratio is greater than 1, the losses are approximately the same and the wall thickness will have little effect on electrical efficiency.
Optimal Design for Cooling of the Inductor
The previous section described the heat generation in the copper tube. In this section, the focus will be on heat extraction. Heat extraction depends upon the wall thickness of the inductor and the water pressure. The convective heat transfer coefficient inside the coil was calculated for a water pressure of 20 psi and 40 psi across a leg of the inductor. The difference in temperature between the two water pressures was analyzed to see the cooling response of each case. Figure 7 shows the percent decrease in temperature from increasing the water pressure 20 psi to 40 psi.
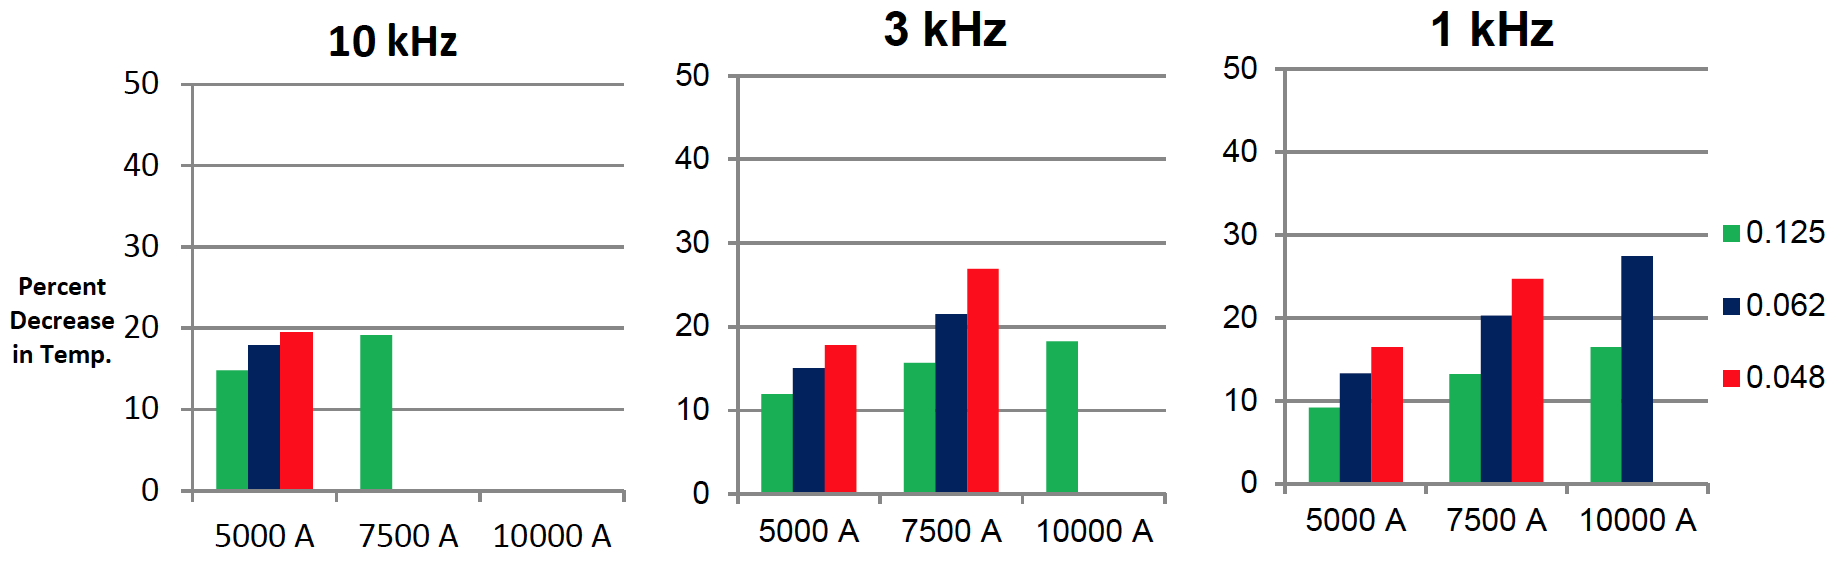
Figure 7: Percent Decrease in Temperature from Pressure Increase of 20 psi to 40 psi (Cases where the inductor reached over 250°C are dropped from the study)
The results show a correlation between wall thickness and the temperature decrease. When the water pressure is increased, thinner walled coils cool more efficiently. Cooling is more efficient for thin walled inductors, since the cooling source is in closer proximity to the hottest part of inductor, which is the outer face. Additionally, as current is increased, the cooling response increases. This is because the inductor reaches a higher temperature at higher current, and there is more heat transfer as the coil gets hotter. Figure 8 shows the temperature distribution for the 3 kHz, 7,500 A case at two different wall thicknesses.

Figure 8: Temperature Distribution Change with Water Pressure at 3 kHz and 7,500 A
The copper temperature is higher in both cases for the thinner copper wall, because the wall thickness is sub-optimal at this frequency (t/δ = 0.84). However, the temperature response for the thinner walled tube (0.048”) is higher to the increase in water pressure than the thicker walled case (0.125”). Temperature decreases 40°C for the thin walled case, but only decreases 15°C for the thick walled case. When designing an inductor is important to consider this effect of the wall thickness on cooling, but this must be balanced with the effect of the reference depth to wall thickness ratio discussed in the previous section to find the optimum for minimizing coil copper temperature.
Temperature Distribution during Cycling
In most cases, induction coils are used repeatedly in cycles with power being turned on and off. The temperature will be higher after consecutive cycles than it is after the first cycle. During the periods when power is turned off, cooling will not be able to fully bring the entire inductor back to ambient temperature. Overtime, however, a periodic steady state will be reached. Cycling of power was modeled for one case to analyze the temperature distribution at this point. In figure 9, the temperature at various points within the inductor is plotted over time.
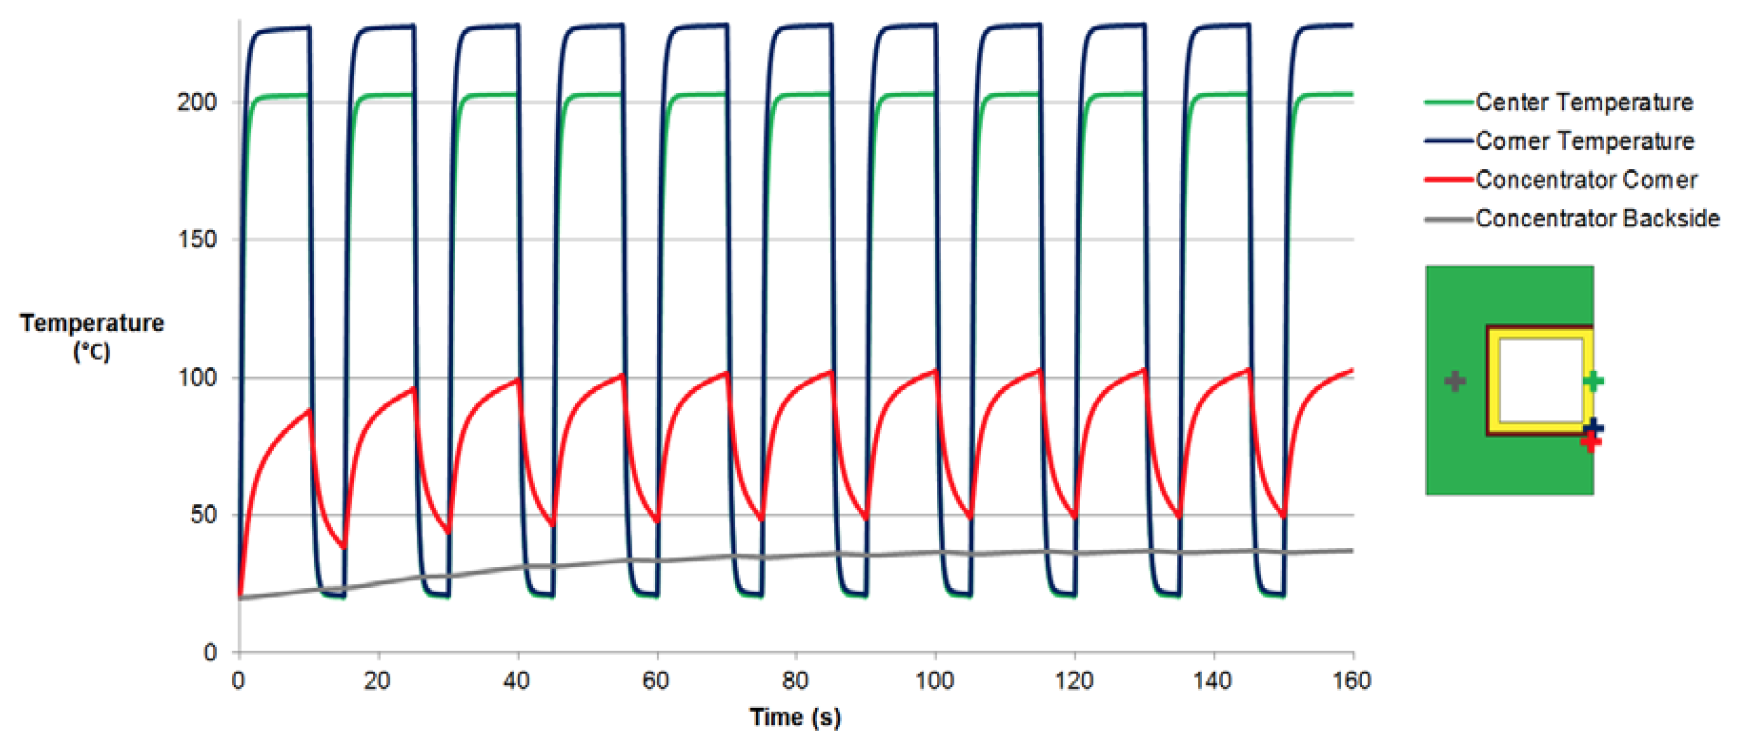
Figure 9: Temperature Distribution during cycling for the 10 kHz, 7,500 A, 0.062”, 40 psi Case
The center and corner of the copper tube are shown to immediately reach a periodic steady state. The concentrator adjacent to the front corner of the tube takes only a few cycles to reach a periodic steady state. It is important to note that the peak temperature in this region only 100°C. This is the hottest part of the flux concentrator and is well below the limit for Fluxtrol materials. The backside of the concentrator is slower to reach steady state, but does so after several cycles. At that point it reaches an almost constant temperature.
The peak temperatures are within the operating limit of the inductor, but there is another concern, which is thermal fatigue. The copper rapidly cycles across a wide temperature range. There will be significant thermal expansion followed by contraction as the inductor cools. The adjacent flux concentrator, separated from the copper by an epoxy layer, also cycles in temperature, but by a much smaller range.
There have been some studies conducted, which combine thermal cycling with mechanical fatigue modeling to estimate induction coil lifetime [4]. The accuracy of these results is unknown at this time. Therefore more work needs to be done in this area to quantifiably predict induction coil lifetime.
Conclusions
Many factors must be balanced in the design of induction coils. FEA simulation in this study has demonstrated the influence of these factors on cooling of the inductor. A single shot coil with Fluxtrol A applied was used for analysis. The wall thickness was found to be a very important factor on cooling efficiency, which went up as wall thickness got smaller. At the same time, however, electrical efficiency decreases when the ratio of wall thickness to the reference depth falls below 1. In this particular case, the optimal wall thickness is approximately one reference depth thick. This is thick enough to keep electrical efficiency high while still thin enough to maintain cooling efficiency.
Radiation from the work piece is often blamed as a contributor for overheating induction coils. FEA simulation was able to demonstrate how it is actually has little effect for an intermittent, single shot heat treating application. When comparing models with and without radiation considered, the maximum temperature only increased 2°C with radiation. Losses from current in the coil are shown to be the primary source of heat in the inductor with radiation being negligible.
Thermal fatigue has been shown to be a major factor on the failure of inductors over time. Electromagnetic and thermal simulation of cycling was used to show the dynamic process. Temperature rises and falls rapidly when power is turned on and off. Additionally, there are large temperature gradients within the inductor. All of this leads to non-uniform thermal expansion in the inductor causing stresses. More insight into the optimal dimensions for induction coil lifetime could be obtained by combining electromagnetic and thermal FEA simulations with stress and distortion modeling.
References
[1] Stuehr, W.I., Lynch, D.: How to Improve Inductor Life, 23rd ASM Heat Treating Society Conference, September 25-28, 2005, Pittsburg, PA, USA. [2] Rudnev, V.I.: Systematic Analysis of Induction Coil Failure, Part 1-11, Heat Treating Progress Magazine, August 2005 – September/October 2007. [3] Goldstein, R.C., Nemkov, V.S.: Influence of Cooling Conditions on Induction Coil Temperatures, International Symposium on Heating By Internal Sources, 2007, Padua, Italy. [4] Svendsen, H., Hagen, S.T.: Thermo-mechanical Fatigue Life Estimation of Induction Coils, International Scientific Colloquium on Modeling of Electromagnetic Processing, October 27-29, 2008, Hannover, Germany.If you have more questions, require service or just need general information, we are here to help.
Our knowledgeable Customer Service team is available during business hours to answer your questions in regard to Fluxtrol product, pricing, ordering and other information. If you have technical questions about induction heating, material properties, our engineering and educational services, please contact our experts by phone, e-mail or mail.
Fluxtrol Inc.
1388 Atlantic Boulevard,
Auburn Hills, MI 48326
Telephone: +1-800-224-5522
Outside USA: 1-248-393-2000
FAX: +1-248-393-0277