Information
Authors: Robert Goldstein, Valentin Nemkov
Location/Venue: HES 2016 Padua, Italy
Download Presentation PDF
Abstract
Effect of unstable “wavy” temperature distribution on the part surface during the process of induction heating of ferromagnetic materials was observed and reported by two Russian scientists in 1940 [1]. They reported that under certain conditions one can observe periodical or quasi-periodical bright stripes on the part surface when its temperature passes thru the Curie point. In time these stripes expand and merge, forming a normal temperature pattern. They called this phenomenon “polosatiy nagrev” (striation heating). Let us call it “zebra effect” for simplicity. It can exist for a relatively long time, from several seconds to several tens of seconds. Several explanations of zebra effect were proposed with not very convincing arguments. There were concerns that zebra effect could set significant limits on use of induction heating for surface hardening due to non-uniform temperature distribution along the part [1-4]. However it did not happen. There were no complaints from scientists or practitioners regarding any negative effect of zebra phenomenon. Moreover, the authors of this paper did not find any original publications on this issue for more than half a century. Only few old induction experts confirm that they observed zebra effect or something similar while a great majority of induction community members never heard about it. Wider spreading of induction technology and use of computer simulation of induction processes create a demand and opens new possibilities for study of zebra effect. Current presentation provides an overview of available information about zebra effect and gives new explanation of this phenomenon based on existing experimental data and new results of simulation. Conditions for zebra occurrence and it technological importance or limitations are discussed.
Introduction
Effect of striation was observed by professors G.I. Babat and M.G. Lozinskii and their findings were published in 1940 [1]. They worked at a large radio tube factory Svetlana in St. Petersburg and were doing a big research on induction technique and technology using HF tube generators. This fact is very important for further discussion. At that time in the USSR there was a very tough discussion about optimal selection of frequency for induction heating, especially for surface hardening. There were no good power sources in middle frequency range (10-100 kHz) and the selection had to be between tube generators and machines (alternators).
When Babat and Lozinskii met the striation effect, they started a detailed study trying to explain why and when it appears and what might be its influence on the emerging induction surface hardening technology. One of the first explanations was that due to magnetostriction effect, the standing waves of mechanical (acoustic) oscillations take place in the part surface. Stresses change electromagnetic properties of material (resistivity in the anti-node area gets lower....) and power in the node areas will be higher resulting in higher temperature. This description allowed explaining the fact that the distance between the temperature stripes drops with frequency increase and supported some other observations. However this description alone could not explain the whole process dynamics and in the latest publication [4] Prof. Lozinskii writes the following: “Currents from the neighbouring zones (having a width of about one to one half of the depth of penetration into hot steel) which have not yet been heated to the Curie point of the steel attempt to enter those annular sections which are the first to lose their permeability”. This increases current density in the “annular sections” and leads to further fast heating of these zones. It means that mechanical oscillations were considered as an effect that triggered striation. All attention in further development of striation was paid to redistribution of induced current, and nothing was said about distribution of the magnetic field, which generates eddy currents. Babat wrote "maybe the process dynamics is more complicated than I described it" [2].
In spite of the absence of proved theoretical explanations, we need to be grateful to these scientists for their extensive experimental study. The results of these studies contain a group of observed facts about striation effect and attempts to create experimental dependences for conditions for appearance of stripes, distance between the temperature "nodes", specific power, frequency and duration of the effect.
It is important to keep in mind that both Babat and Lozinskii used tube generators with frequency from several hundred kilohertz to several megahertz and tried to keep constant voltage on the inductor, considering this regime as "natural" for HF heating.
The results may be summarized shortly as follows [2-4]:
- Zebra effect can be observed when heating magnetic bodies to a temperature approaching to Curie point. The effect is well pronounced for pure iron (dynamo iron), then for carbon steels and less for alloyed steels.
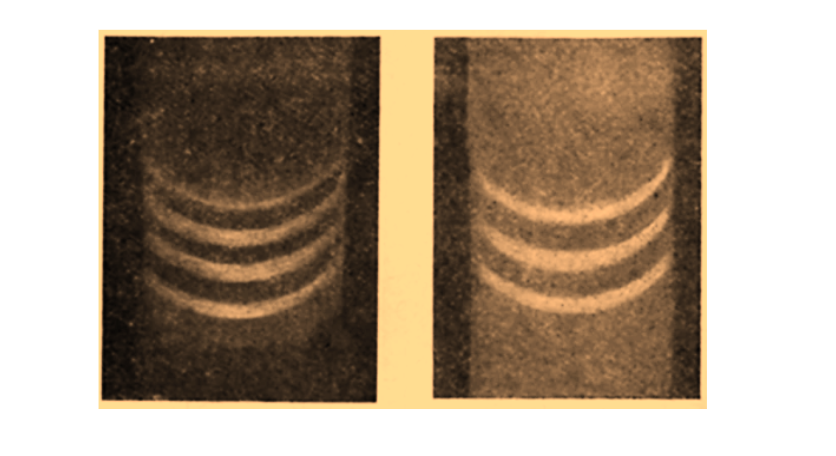
- Number of stripes depends on frequency and the distance between nodes is larger when frequency is lower (figure 1).
- Stripes can appear when heating in multi-turn and in single-turn inductors (figure 2).
- There are minimal level of power at which zebra effect exists. Pi > 1000/δ, W/cm^2, where δ is a penetration (reference) depth for hot steel (above Curie Point).
- Distance x between temperature maximais app. 2000/√f, mm, where f is in hertz. It means that for f = 1 MHz x = 2 mm while for 10 kHz x = 20 mm.
- Period of zebra's existence τ = 3δ^2, i.e. τ = app. 1 sec at 1MHz and 100 sec at 10 kHz.
- Stripe pattern can change during heating. Stripes become wider and finally merge, forming a normal "smooth" temperature distribution on the surface.
One of the main statements of both authors was: "It isn't possible to obtain uniform hardened layer with a thickness less than δ, in a zone wider than 5δ." However it was said also that wider zone may be achieved at lower frequency and fast heating with high power [3,4]. No experimental data on zebra effect for heating at any "low" frequency (let us say less than 50 kHz) were found in available literature.
Since the last publication of Prof. Lozinskii [4], zebra effect was not mentioned in any publication on induction heating (to our knowledge) for a half century. We can propose the following explanation for such a strange situation: regimes, corresponding to zebra effect, are out of the mainstream of studies and practical applications. Plus, some users observed some periodical variations in temperature distribution in the process of heating but did not attribute them to zebra instability. For scanning heating in a single-turn coil, it might be attributed to a well-known "barber pole effect", caused by lower heating of some portions of rotating parts passing zone of weaker field in the zone of the coil's leads. For multi-turn coils such an attribution may be to local non-uniformities under individual coil turns. In simulation we can assume that zebra effect was missed mainly due to insufficient knowledge on (and attention to) the behavior of magnetic permeability near the Curie point Tc. For example, in a well known program Elta [5], permeability is approximated by equation (1) with initially default value of n = 2. However any other value of n can be selected by the user.

Here μ(H) is dependence of μ from field strength H at room temperature. Temperature dependence is described by parabola. Initally value n = 2 was selected according to some data for surface hardening of machinary parts at relatively low frequencies and high power densities (up to 10 kW/cm2 [6]). In other widely-used program Flux 2D/3D approximation is exponential [7]. In both programs it is the user who must select values of n or Ct. 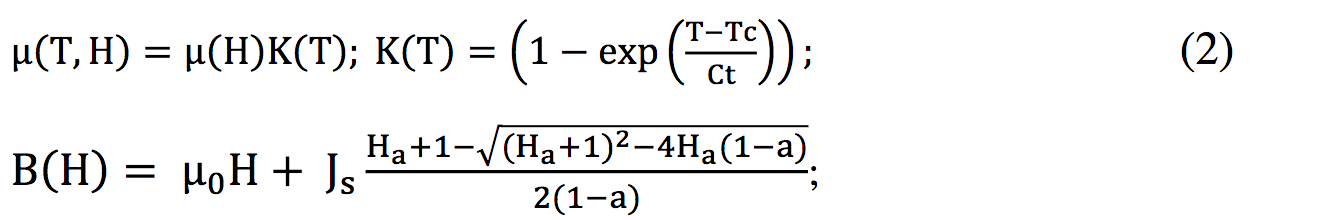 where value
 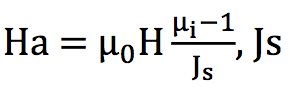 - saturation flux density, μi–initial permeability, a is a “knee” adjustment coefficient of the μ(T) curve.
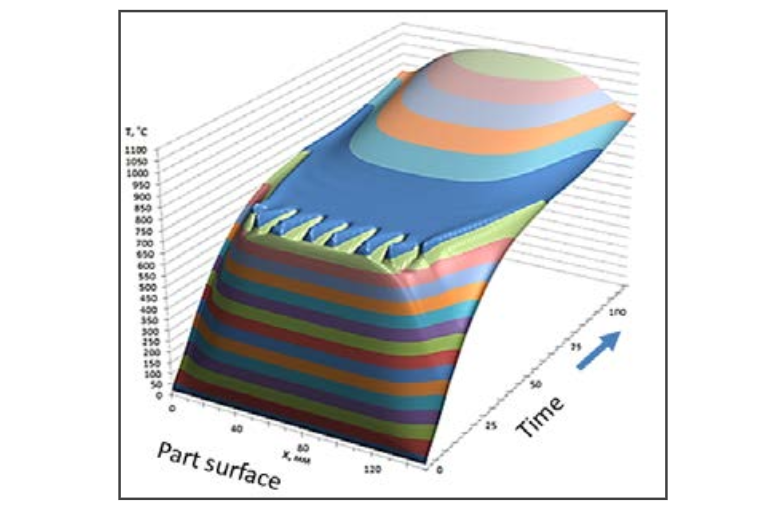
Recently Prof. S.V. Dzliev and his group from university LETI, St. Petersburg, Russia, reported that they observed heat pattern, typical for zebra effect, when heating steel rods stationary or by scanning [8,9]. They made an attempt to simulate the process using 2D FEA software and were able to reproduce it when varied the curve of temperature dependence of the magnetic permeability. This investigation paid our attention to a forgotten effect and resulted in several important findings. One of them is a dependence of permeability from temperature. They showed that, when using in simulation formula (1), there was no zebra effect for low value of n (e.g. n = 2). It appeared for n = 25, which they used for further simulation. An example of the surface temperature along the rod with a length of 150 mm is presented on figure 3. It is clear that in time period of app. 10-20 seconds there are oscillations typical for zebra effect. Unfortunately both articles did not contain enough information for reproducing either experiments or simulation. The authors noted that zebra effect is caused by “instability of permeability” near the Curie point, which results in "auto-oscillations". However, this statement does not explain the mechanism of striation.
Study
A review of available information showed that a study of zebra effect is a very difficult task due to multiple factors involved, uncertainty in effect evaluation criteria and insufficient information about the material properties, especially about permeability near Curie point. To our opinion, the factors that influence the zebra effect, are: current frequency, power supply mode (fixed or varying in time coil voltage, current or power), system geometry (cylindrical or flat system, coil and part dimensions, single or multi-turn coil, etc.), part material (permeability, specific heat, electrical and thermal conductivities) and mode of operation (static or scanning).
This study is concentrated on finding conditions of zebra effect existence, dynamics of its development and on attempt to explain physics of this effect. 2D simulation program Flux 2D is the main tool for a study. Elta program was also used for comparison of the results of simulation with and without account for zebra effect influence on the heating process and system parameters. Traditional frequency domain approach [6,10] is used in both above mentioned programs.
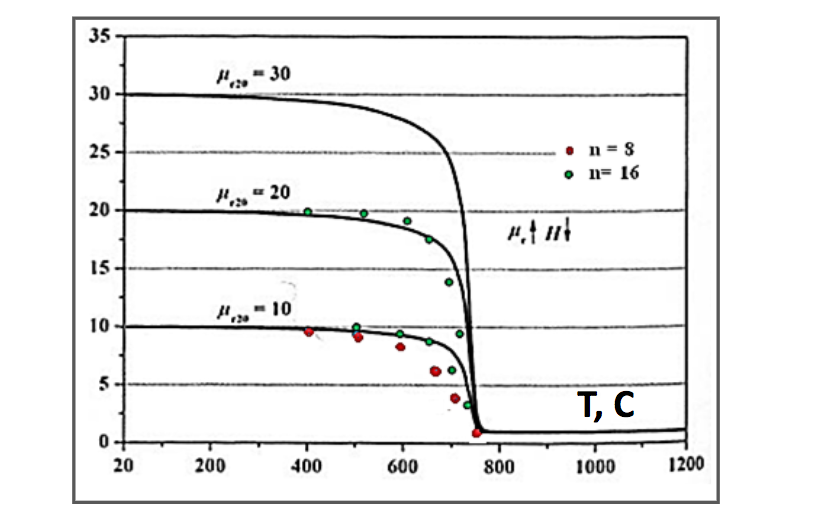
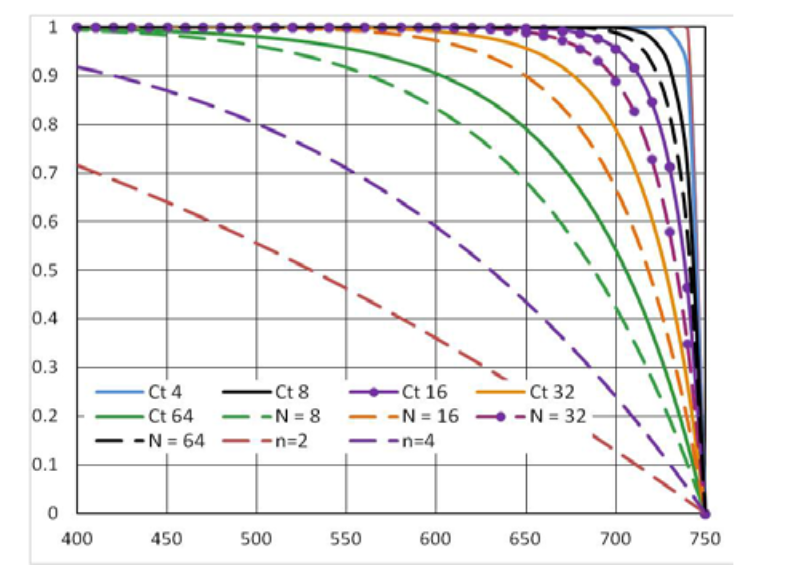
Coefficient of thermal dependence of permeability. Variation of magnetic permeability with temperature is a very complicated problem and information about it is quite insufficient, especially for "industrial" steels typically used in induction heating processes, such as carbon and low alloyed steels. Demand for more accurate simulation [11] led to several newer studies in this area [12, 13]. Analysis of literature shows that in low magnetic fields the permeability drops with temperature much slower than in the strong fields, figure 4. Figure 5 shows curves of temperature coefficient Kt for different values of n and Ct in formulas 1 and 2. These curves allow us to see permeability variation with temperature and correlate simulations results when using Flux 2D and Elta. Temperature dependent values of electrical resistivity, heat capacity and thermal conductivity are used in simulation the same as in Elta.
System description. Two system geometries have been used. In the first case a single turn 127 mm long cylindrical coil with internal and external diameters of 42 and 46 mm was used for heating a rod with diameter 31.8 mm and length 200 mm. Rod material is steel 1040 (0.4% of carbon) (μi = 500, a = 0.3, Js = 1.8 in Equation 2). The induction coil was presented as a current layer (Litz coil) or impermeable for field layer (solid copper sheet), figure 6. The second case was for a 127 mm long piece of an infinitely long system, in which there must be no "external" factors for a non-uniform field distribution in length that could trigger zebra effect. The part diameter and properties are the same as in case 1. One quarter of system was simulated. The coil was energized by constant current or constant voltage at frequencies 20 and 40 kHz.
Results of Simulation
Case of finite length of the coil. Color maps of temperature and magnetic field lines are presented on figure 7 for the coil current 2000 A (in half of system length), different values of Ct and two frequncies -20 and 40 kHz. For Ct=64 the process of heating was traditional, without zebra effect. Non-magnetic layer with uniform thickness was in the central zone of the coil. For Ct = 32 at 20 kHz three hot stripes started to appear after app. 16 sec, reached maximum at app. 22 sec and merged at t=26-28 sec forming a traditional heat pattern.
At Ct =16 the process was approximately the same as for Ct = 32.
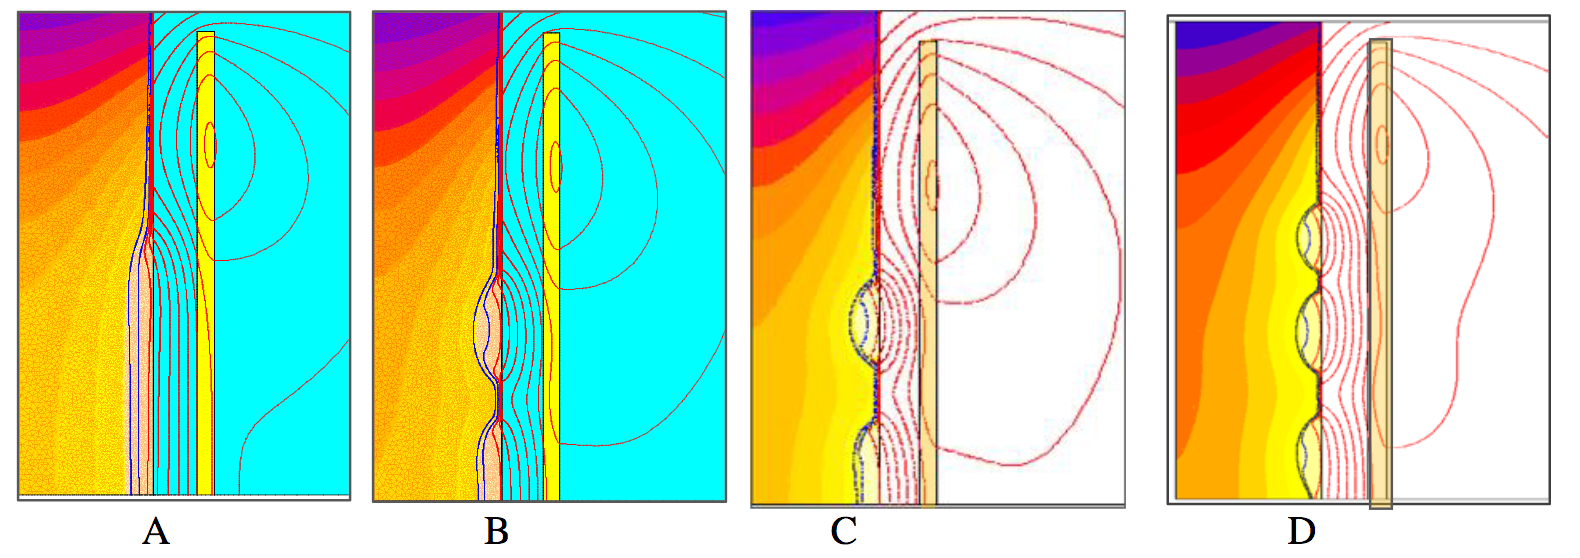
Times of start and end of zebra effect were aproximately the same for both values of Ct. There are three hot zones in the whole length of the system with a pattern similar to that on figure 3. Distance between the temperature maxima is app. 23 mm, which is about 1.5 times greater than from formula 2000/√f.
At frequency 40 kHz there are 5 or 6 stripes on the whole length of the system (depending upon the time) and heating time was much shorter with maximum zebra effect at 16 seconds.
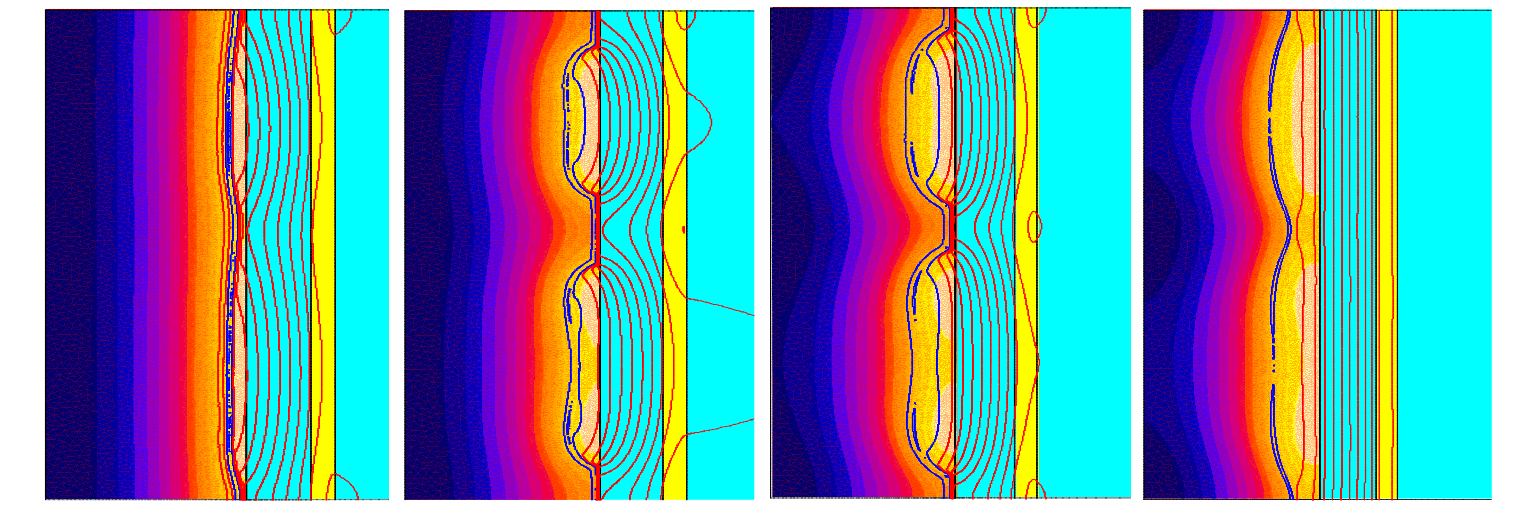
Case of infinitely long system. Most of the study was made from a piece of infinitely long system (total length of this system equals to 63.5 mm). Dynamics of zebra development and decay presented on figure 8. Litz coil carries current 2000 A, frequency 20 kHz, Ct=16. Uniform heating continues for the first 12 seconds. At 16 seconds two shallow hot zones appear, which become deeper and slightly wider and during 26-28 seconds these zones merge and all the part surface becomes non-magnetic. It is interesting that lower zone is wider than the upper one without any visible reasons. Temperature in the middle of lower zone is slightly less than near its sides. This feature was observed by Prof. Lozinskii.
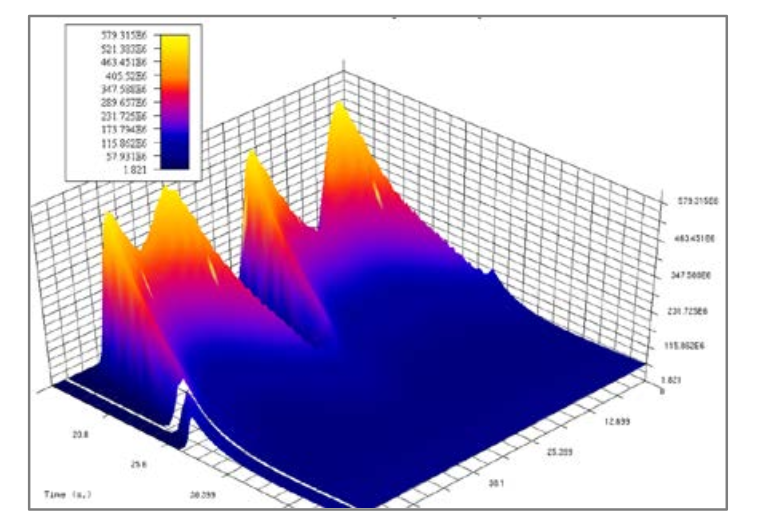
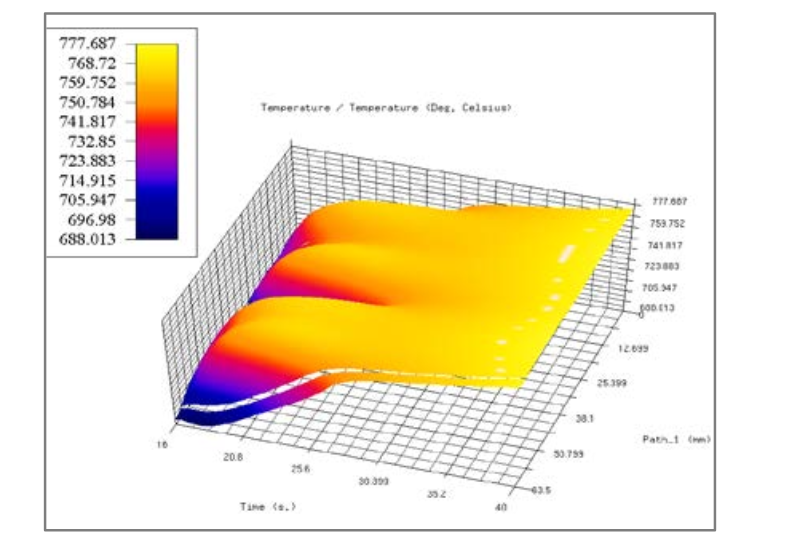
3D graphs of power density and temperature along the part surface are presented on figure 9. They are similar to pictures in the article in [8].
Other results:
- Zebra effect exists at the coil current 2500 and 3000 A but disappears at 4000 A. We can explain it by lower values of permeability for a given Ct = 16.
- Zebra effect exists when the coil supplied by constant voltage corresponding to "cold" conditions.
- Two or three more hot stripes appeared at frequency 40 kHz.
Analysis of Results
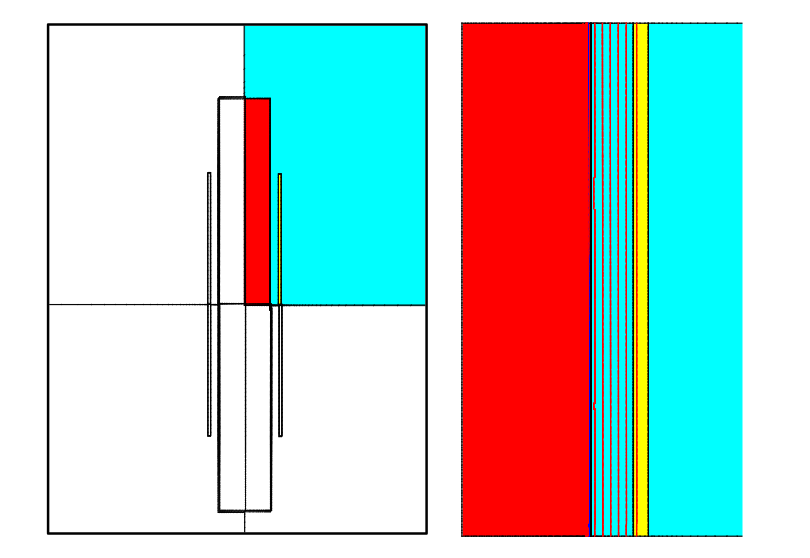
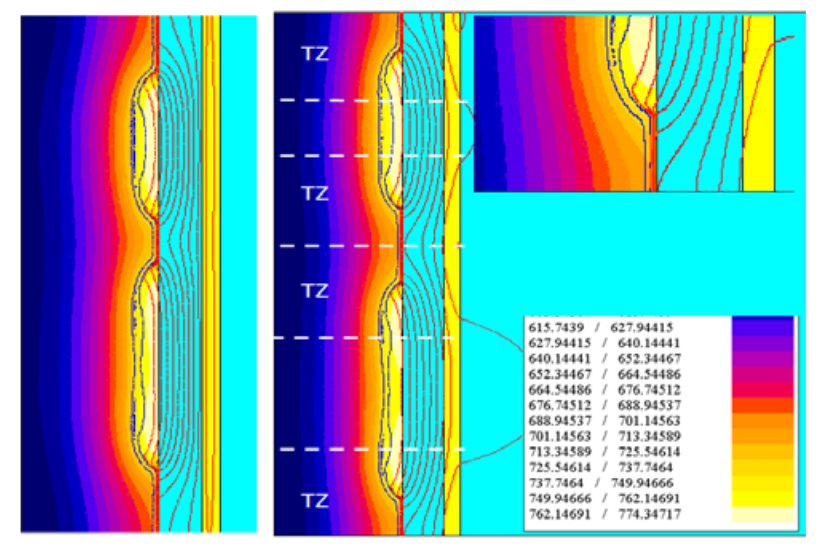
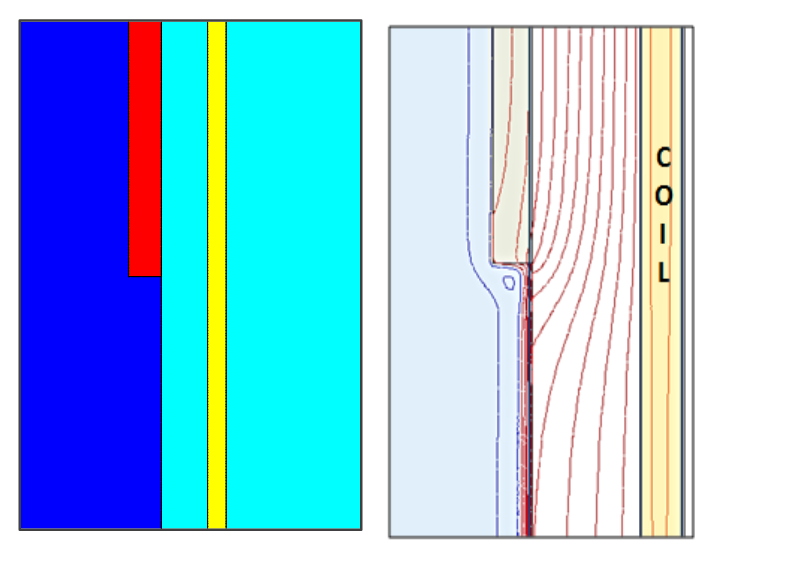
One can see that in all studied cases the transient zones (TZ) from hot (non-magnetic) areas to magnetic areas are almost the same in spite of system geometry and currents. Additional simulation of a system with a coil made of copper sheet (figure 11, left) gave not exactly the same but very similar results. Figure 11, right, repeats a color map of figure 8, time 20 sec with separated transient zones TZ. Magnetic field in the areas between TZ correspond to plane-parallel field and power distribution. This feature allows us to compare TZs with the end effects of cylindrical body, well studied for the ends of magnetic and non-magnetic cylinder in contact with air [14]. In our case there is a contact of magnetic and two-layer bodies. A special electromagnetic only study was made for a system shown on figure 12.
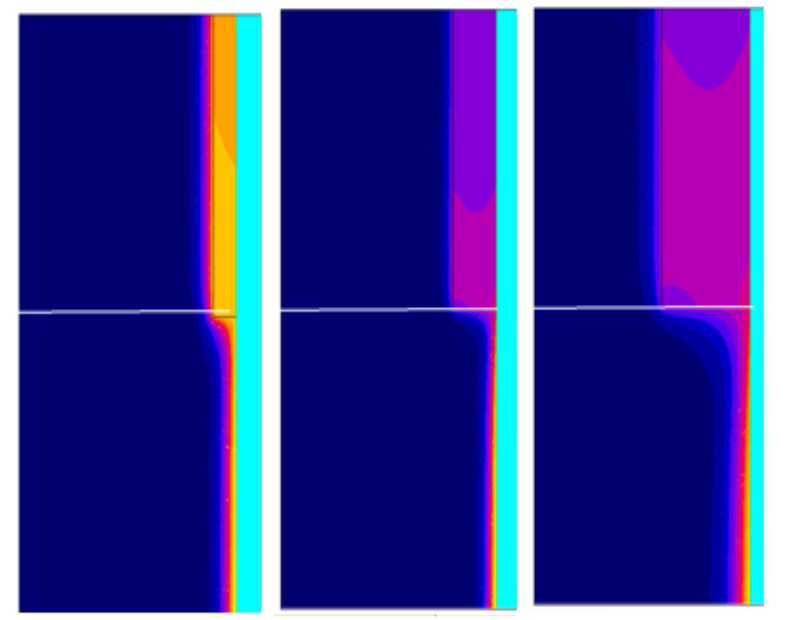
Magnetic permeabiliy of steel in all magnetic portions corresponds to steel 1040 at app. 600 C. Resaistivity is 77 μΩcm. Non-magnetic layer has resistivity 100 μΩcm. Color maps of power density in the part for different thicknesses of non-magnetic layer are presented on figures 13 and 14.
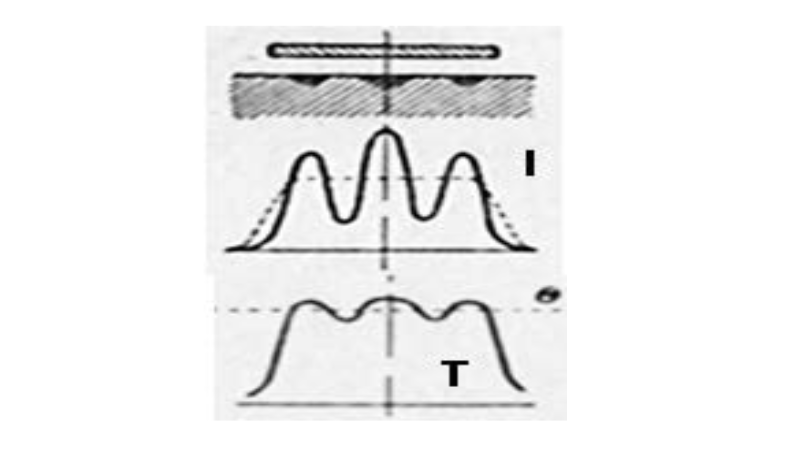
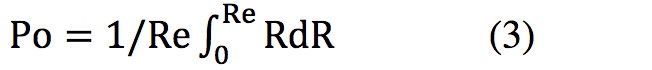
Older version of Flux 2D (which was used for this study) do not conveniently allow calculation of linear power density P0 on the part surface, and we had to export the curves of volumetric power density Pv vs. radius (figure 15) in the most interesting cross-sections and integrate them (formula 3).
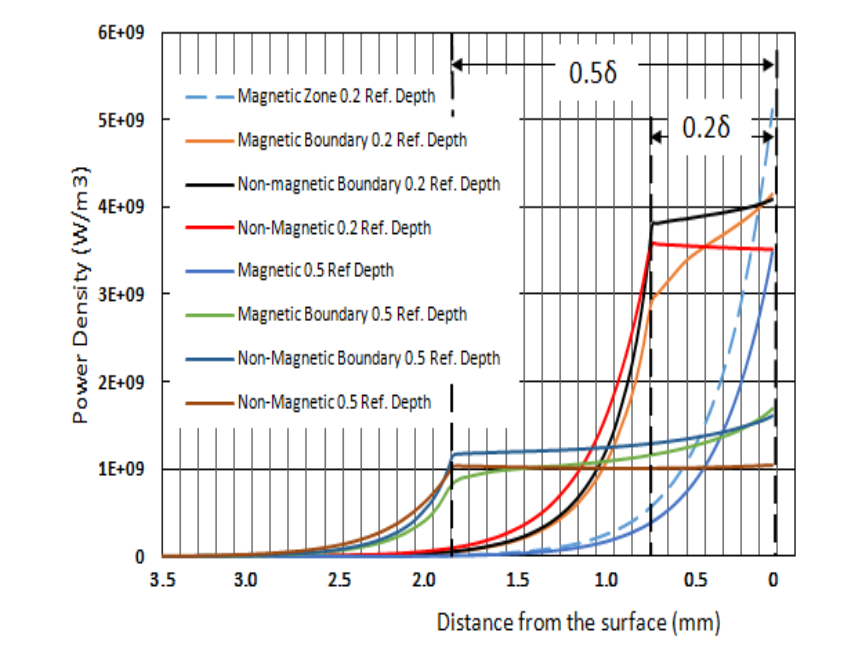
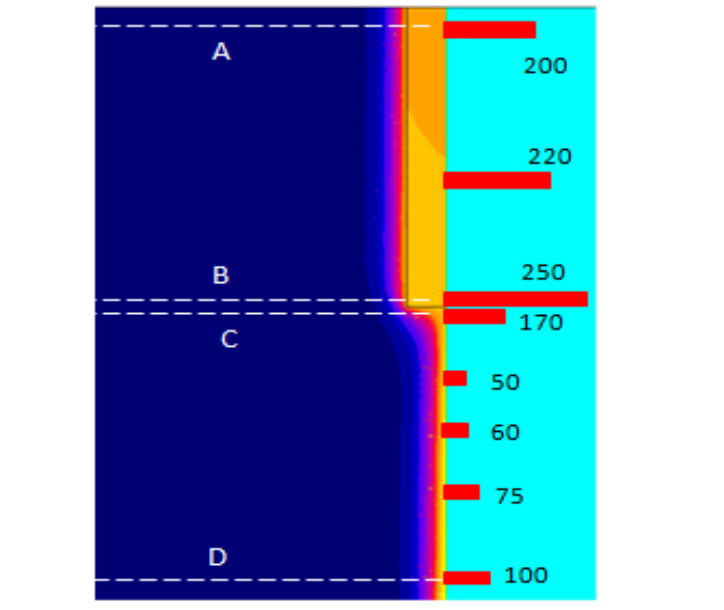
Values of P0 are shown on a graph of figure 14 in the form of red bars. Power values are calibrated to P0 in the regular magnetic zone (bottom of picture 14). Linear power in a system without non-magnetic layer would be equal to 200 units (for a given current and calibration).
Non-magnetic layer 0.2δ thick strongly reduces power in magnetic portion of the part, especially near the border with insert. Linear power has maximum beyond the border and slowly drops with a distance from magnetic portion. This power distribution completely corresponds to what we observe with zebra effect in simulation and in experiments.
These findings allow us to state that zebra effect is caused by redistribution of magnetic field and induced power density in the system due to a special kind of end effect in the border areas of magnetic and partially non-magnetic portions of the part. Increase of frequency reduces width of these transient zones and diminishes the distance between the zebra nodes.
Conclusions
- Computer simulation using Flux 2D program allows us to demonstrate striation (zebra) effect that can appear in the process of heating magnetic materials, and reproduce main experimental finding related to this effect.
- Simulation provides us a great opportunity to investigate zebra phenomenon in virtual reality, providing qualitatively correct results.
- Results of simulation show that zebra effect can appear in a relatively narrow range of material properties and operating conditions. The main factor is a big enough gradient of permeability near the Curie point.
- At present time it is difficult to expect high quantitative accuracy of simulation with the programs used by the authors due to multiple assumptions in simulation algorithm and insufficient or inaccurate information about the material properties near Curie point.
- A basic source of inaccuracy can be a frequency domain approach, which was not validated for big gradients of permeability and temperature. Time domain simulation could be more reliable approach.
- More information is necessary about the magnetic properties of steels near Curie points.
- Further simulation and experimental studies with no doubts will discover many new facts about "mysterious" zebra effect.
References
[1] Babat G.I., Lozinskii M.G. (1940). Surface hardening of steel with treatment by high frequency currents. Narkomsredmash, in Russian.
[2] Babat, G.I. (1965). Induction heating of metals and its industrial applications. Energia, M. -L., in Russian.
[3] Lozinskii M.G.(1949). Industrial applications of induction heating. Academy of Sciences USSR, Moscow, in Russian.
[4] Lozinskii M.G.(1969). Industrial applications of induction heating. Pergamon Press, Oxford, 672 p.
[5] Manual of Elta 6.0. Website www. nsgsoft.com.
[6] Slukhotskiy A.E., Ryskin S.E. (1974). Inductors for induction heating, Energia, Leningrad, in Russian.
[7] Manual of Flux2D/3D. Website. www.cedrat.com.
[8] Dzliev, S.V. et al. (2013). Instability in induction heating of magnetic steels, Journal of Induction Heating, no.23, in Russian.
[9] Dzliev, S.V. et al. (2013). Auto-oscillations in the scanning induction heating of magnetic steel. Journal of Induction Heating, no.24, in Russian.
[10] Neuman L.R. (1948). Skin effect in ferromagnetic bodies, Gostekhizdat, M. (in Russian)
[11] Nemkov V.S. (2015). How accurate is computer simulation of induction heating? Proc. of EPM 2015 conference, Cannes, France.
[12] Zedler T., Nikanorov A., Nacke B. (2008), Investigation of relative magnetic permeability as input data for numerical simulation of induction surface hardening. Int. Scientific Coloquium MEP 2008, Hanover.
[13] Vladimirov S.N, Zeman S.N., Ruban V.V. (2009). Analytical approximations of thermal dependence of permeability of construction steels. Proc. of Tomsk univ., v.31.
[14] Nemkov V.S., Demidovich V.B. (1989). Theory and calculation of induction heating devices. Energoatomizdat, in Russian.
If you have more questions, require service or just need general information, we are here to help.
Our knowledgeable Customer Service team is available during business hours to answer your questions in regard to Fluxtrol product, pricing, ordering and other information. If you have technical questions about induction heating, material properties, our engineering and educational services, please contact our experts by phone, e-mail or mail.
Fluxtrol Inc.
1388 Atlantic Boulevard,
Auburn Hills, MI 48326
Telephone: +1-800-224-5522
Outside USA: 1-248-393-2000
FAX: +1-248-393-0277