Information
Authors: Robert Cryderman (Colorado School of Mines), Finn Bamrud (Colorado School of Mines), Tareq Eddir (Fluxtrol Inc.), Robert C. Goldstein (Fluxtrol Inc.)
Location/Venue: ASM HTS Heat Treat 2021 St. Louis, Missouri
Download Presentation PDF
Abstract
Commercially, carbon steels are induction heated at heating rates on the order of 100 to 1,000 °C·s-1 for surface hardening. The high precision DIL 805L dilatometer employs induction heating and is often used to study transformation characteristics and prepare test specimens for metallurgical analysis. However, heating the commonly used 4 mm diameter by 10 mm long specimens at rates above 50 °C·s-1 results in non-linear heating rates during transformation to austenite and large transient temperature variations along the specimen length. These limitations in heating rate and variances from ideal uniform heating can lead to inaccurate characterization of the transformation behavior compared to commercial induction hardening practices.
In this study it is shown that changing the specimen design to a thin wall tube allows faster heating rates up to 600 °C·s-1 and modifies the pattern of temperature variations within the test sample. The response of selected specimen geometries to induction heating in the dilatometer is characterized by modelling and tests using multiple thermocouples are used to verify the models. It is demonstrated that the use of properly designed tubular test specimens can aid in more accurately establishing transformation characteristics during commercial induction hardening.
Introduction
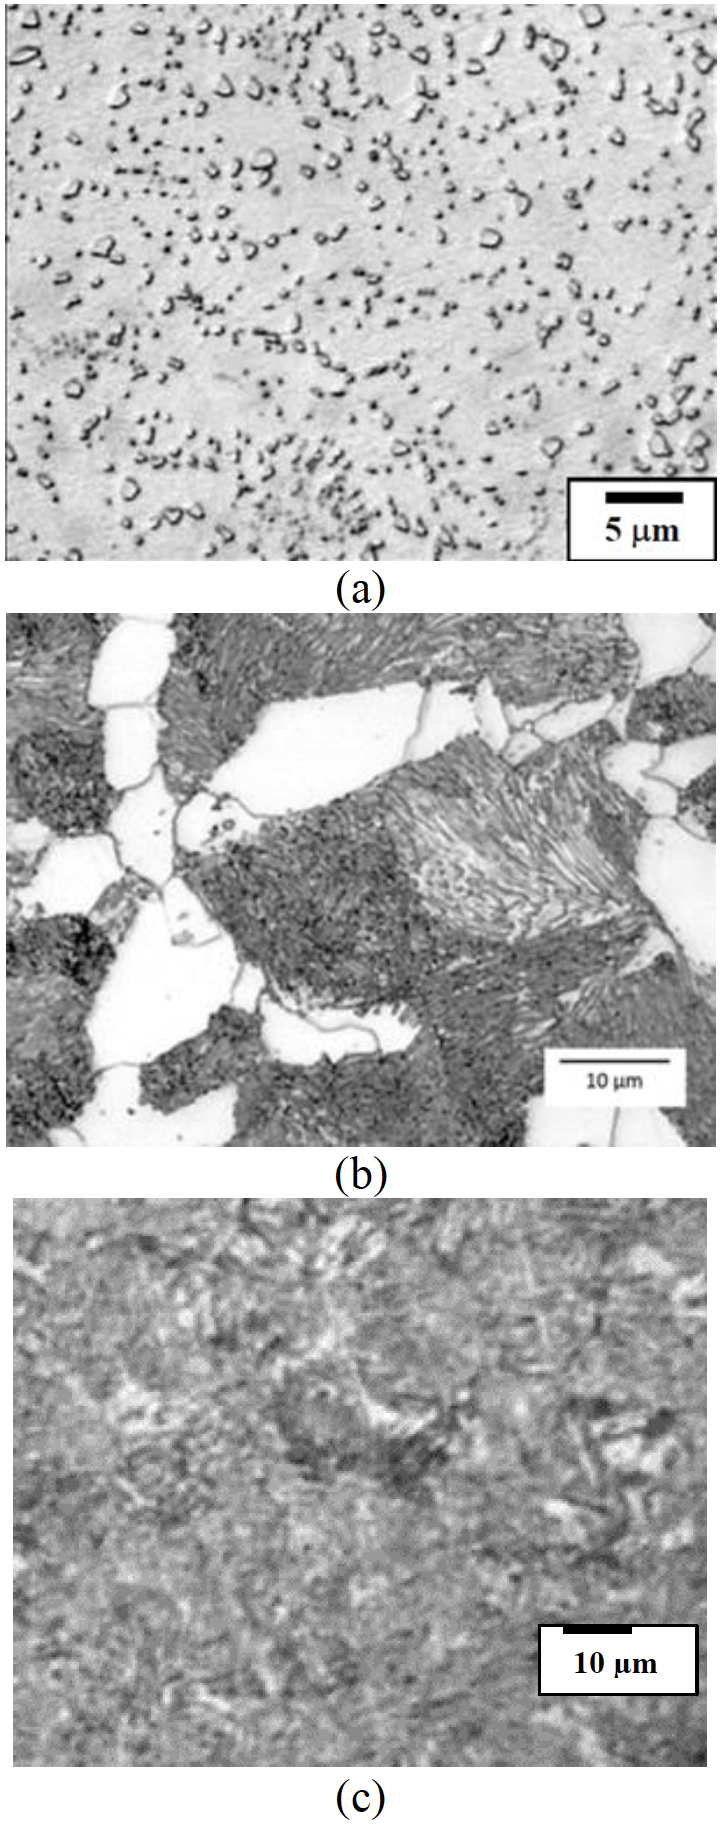
Induction hardening is widely used to produce high strength surface hardened parts such as axles, steering racks, and components for constant velocity joints. These parts are typically manufactured using carbon or low alloy steels containing 0.35 to 0.60 wt pct carbon. The initial microstructures can vary from soft spheroidized cementite, to coarse ferrite-pearlite, to quenched and tempered martensite as shown in Figure 1.
The response of various 1541 steel microstructures consisting of ferrite and cementite to rapid induction hardening with a constant power input and heating time is illustrated in Figure 2 [1]. The main reason for these differences in hardening depth is the temperature and time required to transform the ferrite into austenite and diffuse carbon from the cementite into austenite, with coarser ferrite and cementite areas requiring more time for diffusion.
![Fluxtrol | ASM HTS 2021 Influence of Specimen Design on Maximum Heating Rate and Temperature Variation During Induction Heating in an 805L Dilatometer Figure 2 - Effect of prior microstructure on the response to induction hardening using a fixed power input [1].](/images/ASM-HTS-2021-influence-of-specimen-design-on-maximum-heating-rate-and-temperature-variation-during-induction-heating-in-an-805l-dilatometer-figure-2.png)
The influence of heating rate and peak temperature on the transformations during heating has been characterized in the literature as shown in Figure 3 [2]. As the heating rate increases, the Ac1 and Ac3 temperatures increase, and higher temperatures are needed to homogenize the carbon in the austenite. High speed dilatometry provides the opportunity to study the effects of induction heating rates and peak temperatures on the transformation to austenite and the resulting microstructures after quenching to form martensite. The DIL 805L quenching dilatometer uses induction heating and is a good unit for performing the desired dilatometry tests, but it is limited in heating rate in the non-magnetic austenitic temperature range to about 200 °C·s-1 when using the standard 4 mm diameter by 10 mm long cylindrical specimens. Commercial induction hardening heating rates are often 1,000 °C·s-1 and can be higher. The purpose of this study is to determine what changes in specimen design can be made to increase the heating rate and assess the effect of specimen design on variations in temperature when using the DIL 805L dilatometer.
![Fluxtrol | ASM HTS 2021 Influence of Specimen Design on Maximum Heating Rate and Temperature Variation During Induction Heating in an 805L Dilatometer Figure 3 - Changes in the microstructure of a Ck 45 (1045) steel with heating rate and peak temperature [2].](/images/ASM-HTS-2021-influence-of-specimen-design-on-maximum-heating-rate-and-temperature-variation-during-induction-heating-in-an-805l-dilatometer-figure-3.png)
Dilatometer and Test Specimens
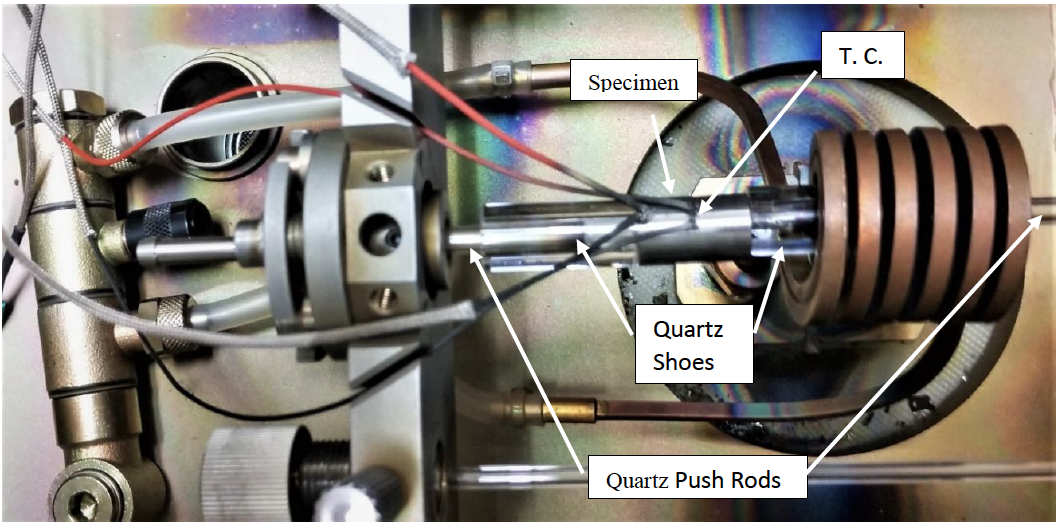
The testing device being used to study nonequilibrium transformation dynamics in this study is a TA Instruments DIL 805L dilatometer shown in Figure 4. The DIL 805L unit heats in vacuum and uses a 3 kW, 150 - 400 kHz induction heating power supply for heating followed by inert gas quenching. Temperatures are monitored and controlled during the process by using a thermocouple welded to the specimen surface at the center. For this study, additional thermocouples were attached on the cylindrical surface near the ends of some specimens. Quartz push rods, 4 mm in diameter, were used to contact the specimen ends for specimens with an internal diameter (ID) smaller than 4 mm. For larger specimen diameters, a short section of the 4 mm quartz tube was welded to the inside of tubular quartz “shoes” with an ID of 4 mm and an outer diameter (OD) of 10 mm. These shoes were slipped onto the ends of the 4 mm diameter push rods to support the specimens and allow measurement of dilation. The test specimens used in this study are summarized in Table 1.
| Steel | Shape | OD, mm | Length, mm | Wall, mm |
|---|---|---|---|---|
| O1 | Solid | 1.5 | 10 | --- |
| O1 | Solid | 2.0 | 10 | --- |
| O1 | Solid | 3.0 | 10 | --- |
| O1 | Solid | 4.0 | 10 | --- |
| 1045 | Solid | 4.0 | 10 | --- |
| 304 SS | Tube | 3.18 | 10 | 0.89 |
| 304 SS | Tube | 4.0 | 10 | 1.0 |
| 304 SS | Tube | 6.0 | 10 | 1.0 |
| 316 SS | Tube | 8.0 | 7.5 | 1.0 |
| 316 SS | Tube | 10.0 | 15 | 1.0 |
| 316 SS | Tube | 10 | 7.5 | 1.0 |
Magnetic O1 tool steel cylinders (O1) and nonmagnetic austenitic 304 or 316 stainless steel tubes (SS) were used to evaluate the effects of specimen design on maximum heating rates and temperature variations. One additional material, 1045 steel, was included to illustrate the effects of non-uniform heating at high rates on dilation and measured transformation temperature.
DIL 805L standard data outputs including specimen temperature(s), specimen length, and per cent of maximum available induction heating power were recorded simultaneously as a function of time. Only a small fraction of the recorded power is absorbed by the dilatometer samples. This creates the opportunity to increase the heating rate by improving the matching of the sample absorption to the output capabilities of the induction heating power supply. Additional work is underway to further optimize the achievable heating rate.
Heating Rate and Temperature Variation in Solid Test Specimens
Solid test specimens of O1 tool steel, 10 mm long, were heated with a programmed heating rate of 500 °C·s-1. The maximum heating rates actually achieved in the ferritic range and austenitic range for the different specimen diameters are summarized in Table 2. The data clearly show that the heating rate in the non-magnetic austenite range at high temperatures is slower than the heating rate for magnetic ferrite at lower temperatures. Also, the heating rates for austenite increased as the specimen diameter increased from 1.5 to 4 mm, indicating better coupling with the induction field.
| Specimen Diameter, mm | Ferrite Heating Rate 200 to 700 °C | Austenite Heating Rate 850 to 1,000 °C |
|---|---|---|
| 1.5 | 468 | 27 |
| 2.0 | 534 | 84 |
| 3.0 | 477 | 145 |
| 4.0 | 457 | 190 |
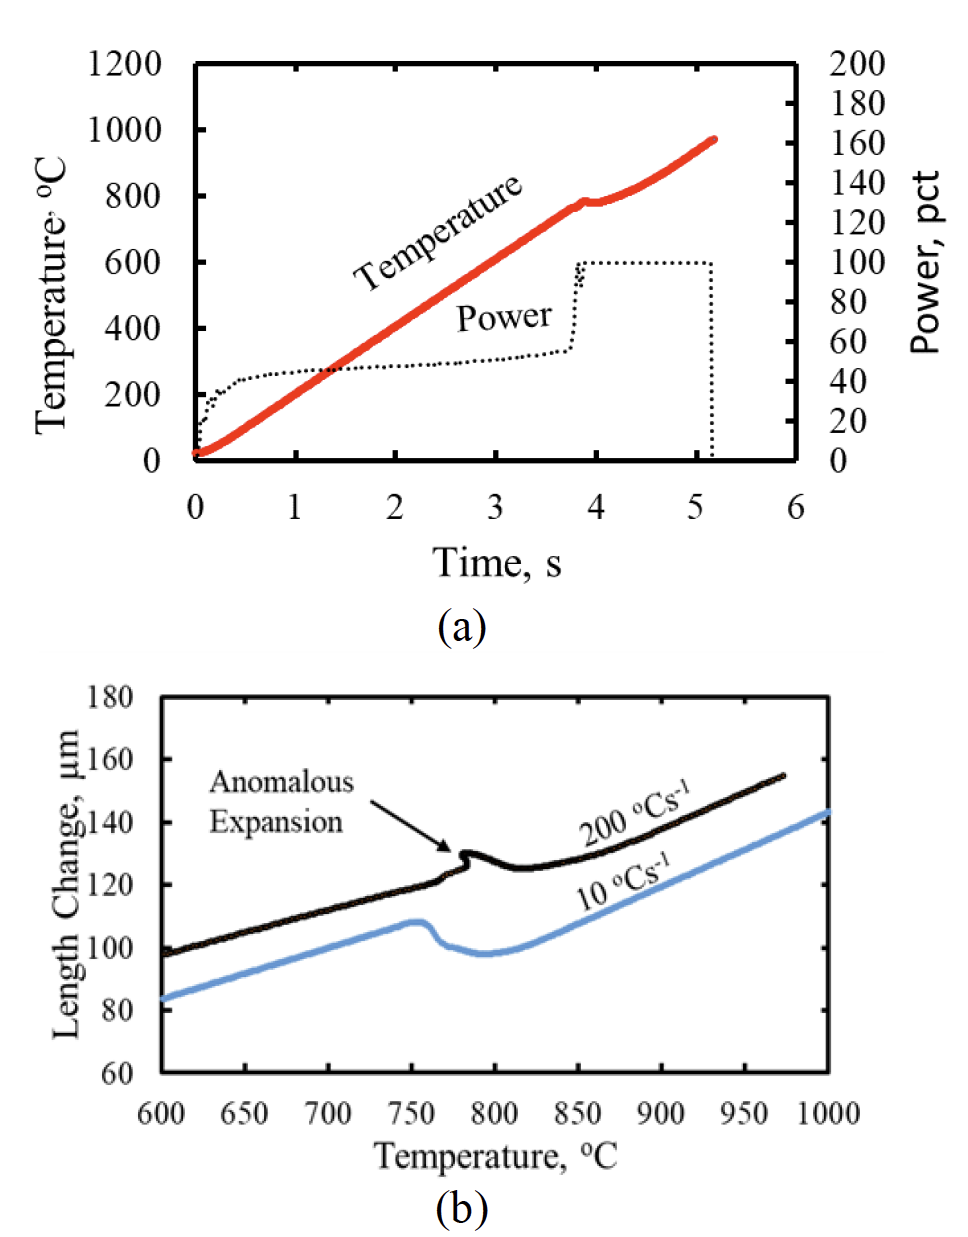
A solid 4 mm diameter cylinder of the 1045 steel from a hardenability study was heated at a programmed rate of 200 °C·s-1 and the time-temperature data shown in Figure 5 (a) indicate that a 200 °C·s-1 heating rate was achieved for both ferrite-pearlite and austenite except for the period where additional energy was needed for the transformation from ferrite-pearlite to austenite [3].
Figure 5(b) shows the dilation versus temperature for heating at 200 °C·s-1 as compared to heating at 10 °C·s-1 showing an increased Ac1 temperature and an anomalous expansion at the Ac1 temperature with the faster heating rate. This anomaly prevents accurate determination of the Ac1 temperature and, as characterized below, is the result of non-uniform temperature gradients with the rapid heating rate.
The transient temperature gradients are illustrated in Figure 6. In Figure 6(a), thermocouples were attached near the specimen ends as well as at the center of the specimen. At temperatures below the Ac1 temperature, the ends were clearly colder than the center. At the Ac1 temperature, the heating rate at the center declined as the center transformed to austenite while the ferritepearlite ends continued to heat at a more rapid rate. Consequently, the dilation increased as the cold ends heated more quickly leading to the apparent expansion shown in Figure 5(b).
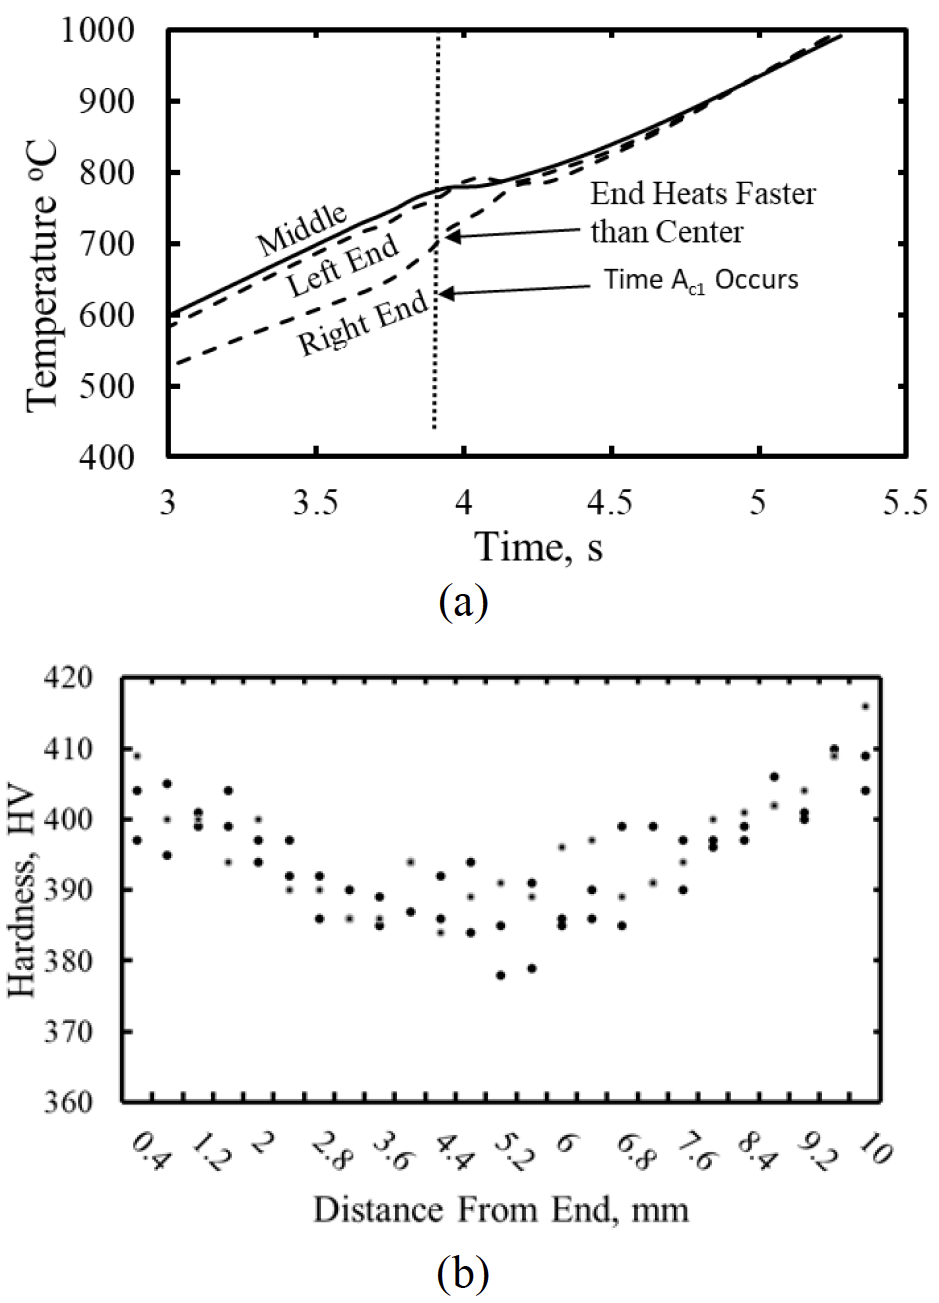
In order to verify the occurrence of the cold ends, a 1045 steel specimen was first austenitized and quenched to martensite and then heated at 200 °C·s-1 to 740 °C and helium quenched. Hardness tests along the length of the specimen shown in Figure 6(b) show that there was less tempering (higher hardness) on the ends as a result of the lower peak heating temperature. The large temperature gradients make it difficult to accurately determine the Ac1 temperature and the rate of transformation to austenite at higher temperatures up to the Ac3. The issue of non-uniform temperature increases as the heating rate is increased as shown in Figure 5 (b).
Heating Rates in Tubular Specimens
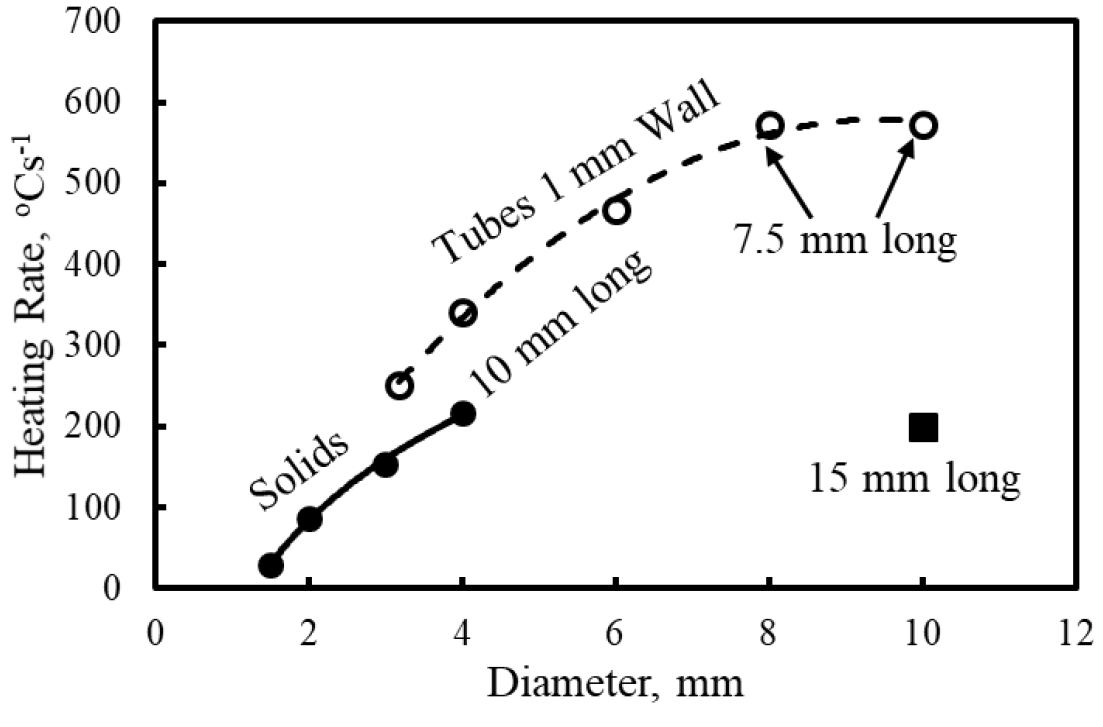
Based on previous experience it was decided to conduct heating rate tests in the dilatometer using a variety of specimen designs and then use a model to examine the expected temperature variations [4]. Specimens 10 mm long were cut from the 3.1, 4, and 6 mm diameter type 304 stainless steel tubes and heated at maximum power in the dilatometer to determine the maximum heating rate at the center of the specimens. The results are presented in Figure 7 along with the results for the cylindrical O1 steel specimens heated above the Ac3 temperature. At 4 mm diameter, the maximum heating rate for the austenitic tubes was about 125 °C·s-1 higher than the limit for the solid cylinders. Also, the heating rate increased with the tube diameter to about 480 °C·s-1 for the 6 mm diameter stainless tube. Specimens of 8 and 10 mm austenitic 316 stainless steel tubes cut to 7.5 mm long and heated with the maximum power resulted in a maximum heating rate of 572 °C·s-1 for both of these larger diameters. This result indicated that the maximum heating capability was achieved. A further test using a 15 mm long 10 mm diameter tube resulted in a lower heating rate of about 200 °C·s-1 confirming that the power limit was exceeded.
Modelling of Temperature Variations
Flux 2D software was used for electromagnetic and thermal simulation to understand the temperature distributions for the different specimen geometries, material properties, and heating rates. 1045 and stainless steel material properties were used to compare heating differences between magnetic and non-magnetic steels. Temperature data from the center of the specimen length (T. C.) and 1 mm from the end was collected for comparison. Current supply was controlled to achieve the desired heating rates at the T. C. Additionally, temperature contours, maximum temperature, minimum temperature, average temperature, temperature gradient, and electrical parameter data were collected from the models for comparing the different simulations.
Results of Model Calculations
The models were used to calculate temperature distributions in several specimen types during heating. A temperature map for the reference 4 mm diameter by 10 mm long 1045 solid steel specimen at an average temperature of 720 °C for the maximum heating rate (200 °C·s-1) is shown in Figure 8(a). The chart in Figure 8 (b) shows the change of temperature with time at the center thermocouple (T. C.) location and 1 mm from the end of the specimen. The maximum and average differences in temperature relative to the center thermocouple are shown as Max and Avg delta T, respectively. The Avg delta T is of importance with respect to measuring the dilation over the full specimen volume. For example, in Figure 8 (a), the average temperature (delta T in Figure 8 (b)) was 56 °C lower than the temperature measured at the specimen center just before reaching the Ac1 temperature - so the measured Ac1 temperature reading could be as much as 56 °C higher than the actual.
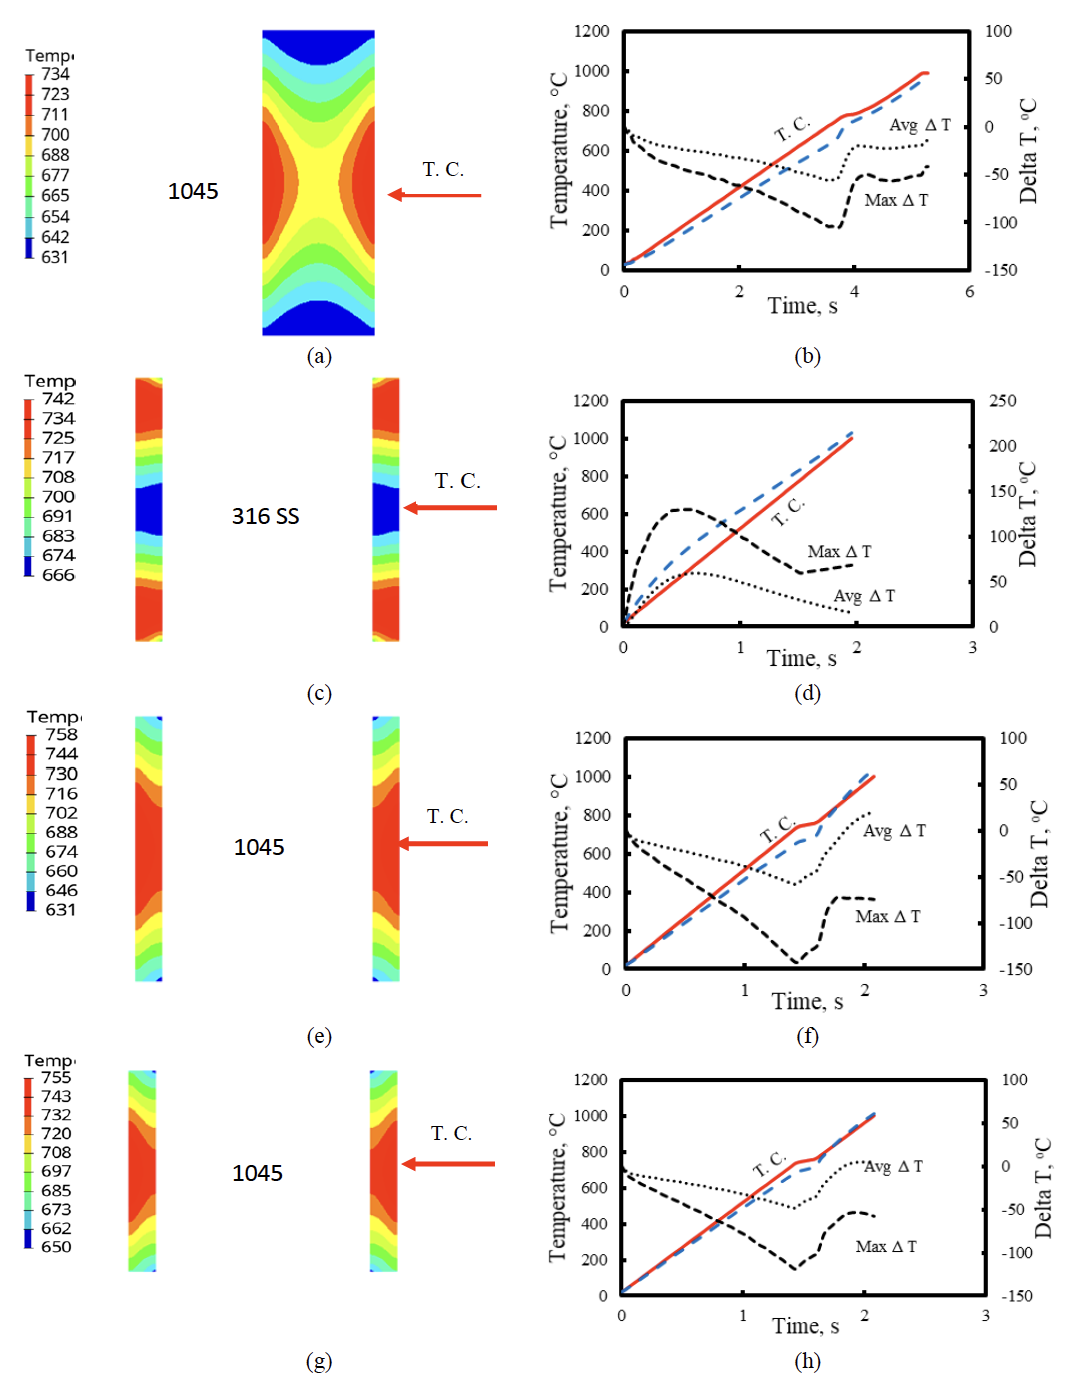
It should be noted that the data for the tubular specimens in Figures 8 (f) and (h) reflect a higher heating rate of about 500 °C·s-1 as compared to the 200 °C·s-1 limit for the solid specimen in Figures 8 (b), and the time scales were adjusted accordingly.
From the color maps, in Figures 8 (a), (b), 8 (e), (f). and 8 (g), (h) it can be seen that during heating the magnetic ferrite-pearlite microstructure 1045 steel to the Ac1 temperature, the specimen was hottest at the center thermocouple location and coldest at the ends. The delta T values for the 1045 steel specimens increased progressively with time up until the beginning of transformation to austenite and then declined to minimal values at the completion of the transformation.
By contrast, during heating of the 10 mm diameter by 10 mm long non-magnetic austenitic stainless steel specimen, the temperature map and chart in Figures 8(c), (d) clearly show that the specimen ends were hotter than the temperature indicated by the center thermocouple. The difference in temperature first increased with time and then decreased at longer times and higher average temperatures. It should be noted that the delta T curves for the stainless steel specimen in Figures 8 (c), (d) are all positive whereas they are negative for the 1045 steel specimens.
The temperature model for the tubular 10 mm diameter by 7.5 mm long magnetic, ferrite pearlite 1045 steel (Figures 8 (g), (h)) shows that the center heats faster than the ends, but there is less gradient from the outside to the inside as compared to the solid specimen in Figures 8 (a), (b). Also, the maximum temperature gradient was lower for the 7.5 mm long specimen (Figures 8 (g), (h)) as compared to the 10 mm long specimen (Figures 8 (e), (f)). This simulation assumed a fixed heating rate of 500 °C·s-1 for the 7.5 mm long specimen and that this rate was maintained in the austenite region after the transformation from ferrite-pearlite. Presumably, once the 1045 steel is heated beyond the Ac1 temperature where austenite begins to form and progressively increases up to the Ac3 temperature, the specimen ends would heat faster than the center as was observed for the austenitic stainless steel specimens.
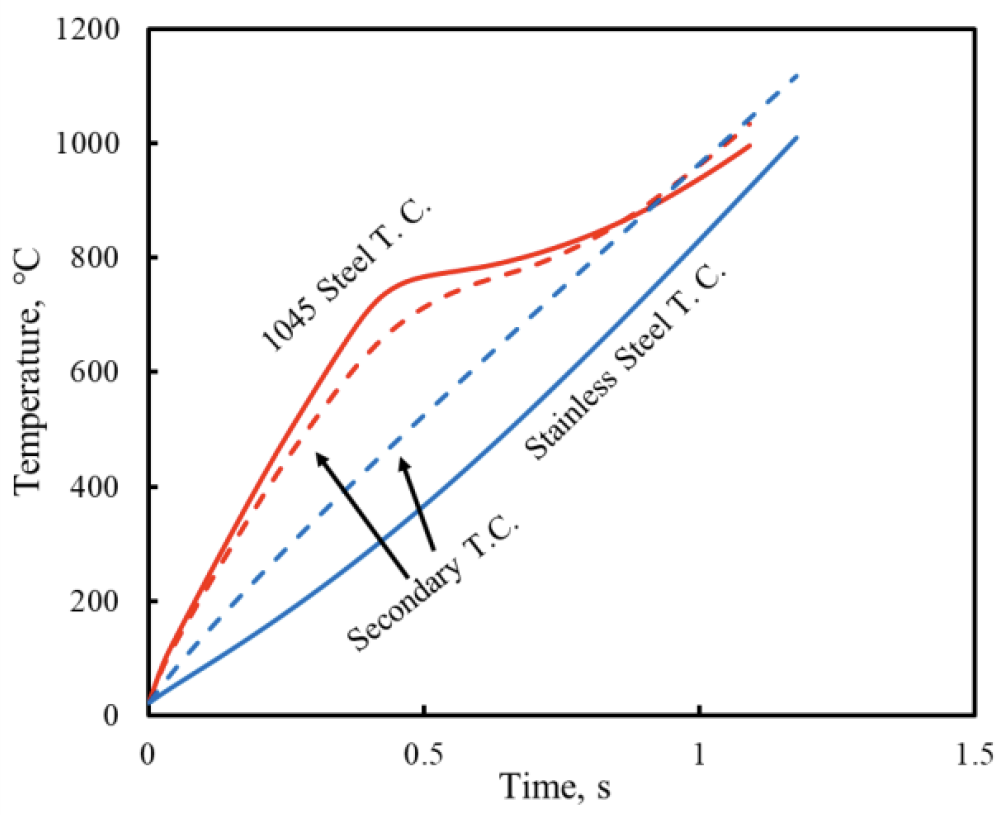
For illustration, the calculated heating curves for 10 mm diameter by 10 mm long tubular specimens of the 1045 steel and the austenitic stainless steel heated with an assumed fixed coil current of 225 amperes are compared in Figure 9. The temperature curves reflect the negative temperature variation compared to the center thermocouple for the 1045 steel and the positive temperature variation compared to the center thermocouple for the stainless steel. The curve for the 1045 steel indicates that heating rates faster than 500 °C·s-1 are possible for the magnetic ferrite pearlite structure, but not during the transformation to austenite.
Heating Tests of New Specimen Design
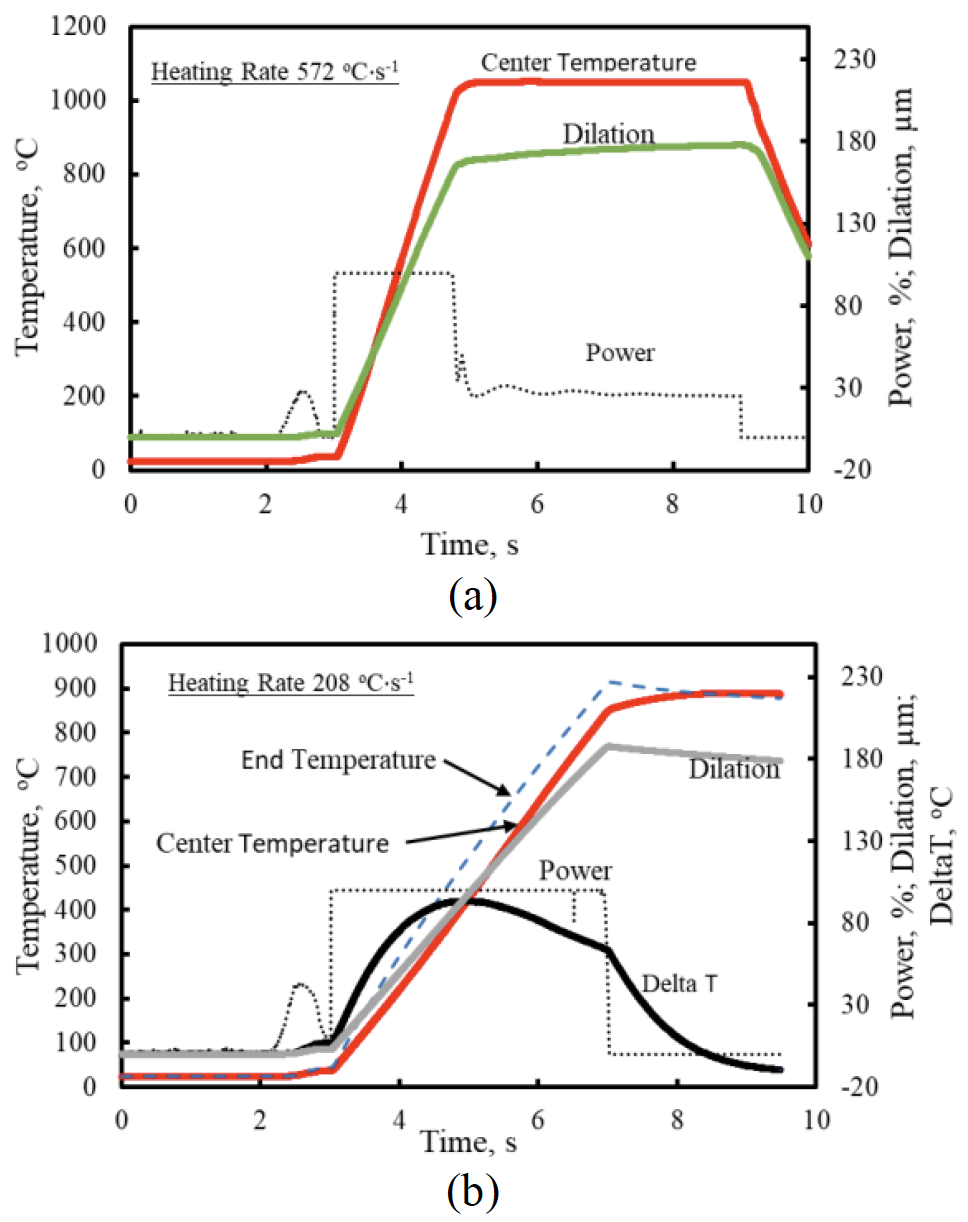
Based on the earlier test results and guided by the modelling, it was decided to use a 7.5 mm long by 10 mm diameter tube with a 1.0 mm wall thickness for tests on the dilatometer. Preliminary tests were conducted on austenitic 10 mm diameter stainless tube specimens at both the 7.5 and 15 mm lengths. The test results are shown in Figure 10. The test results verified that a heating rate of 572 °C·s-1 is possible for the 7.5 mm long specimen, but the heating rate dropped to 208 °C·s-1 as the specimen length was increased to 15 mm.
Conclusions
From induction modelling and verification tests conducted in the TA DIL 805L dilatometer it has been shown that heating rates for 1045 steel can be increased with the existing induction heating system. by changing from a solid cylindrical specimen to a tubular specimen.
- By changing from a 4 mm diameter by 10 mm long solid specimen to a shorter 7.5 mm long by 10 mm diameter by 1 mm wall thickness specimen the maximum heating rate for austenite was increased from 200 °C·s-1 to 572 °C·s-1
- Temperatures at the ends of the specimens were colder than the center when heating magnetic ferrite pearlite microstructures and hotter than the center when heating non-magnetic austenite
- Heating rates for magnetic ferrite pearlite microstructures at maximum power were higher than those that could be achieved for non-magnetic austenite.
- Reducing tubular specimen length below 10 mm allowed higher heating rates and reduced the temperature variation.
- For the 1045 steel specimens, tested and modeled, temperature variations (delta T) along the specimen length persisted at high heating rates that resulted in overestimating the Ac1 temperature by up to 57 °C. Shorter 7.5 mm long tubular specimens reduced the maximum average delta T to 48 °C.
Acknowledgements
The authors acknowledge the support of the corporate sponsors of the Advanced Steel Processing and Products Research Center, an industry/university cooperative research center at the Colorado School of Mines for the experimental work and the support of Fluxtrol. Inc for all of the temperature modelling. Thanks also to Michael Sanders at CSM for welding the quartz shoes used in the experiments.
References
[1] J. Coryell, D. Matlock, and J. Speer, “The Effect of Induction Hardening on the Mechanical Properties of Steel with Controlled Prior Microstructures,” Heat Treating for the 21 st Century: Vision 2020 and New Materials Development, Proceedings of Materials Science and Technology, AIST, Warrendale, PA, 2005, pp. 3-14.
[2] J. Orlich, A. Rose, and P. Wiest, Ed, “Temperatur-Austenitisierung-Schaubilder,” Atlas zur Warmbehandli-Austeningder Stahle, Vol 3, Zeit Verlag Stahleisen M. B. H. Dusseldorf Germany, 1973.
[3] R. Cryderman, D. Garrett, Z. Schlittenhart, and E. Seo. “Effects of Rapid Induction Heating on Transformations in 0.6% C Steels,” Journal of Materials Engineering and Performance, ASM International, 2020, /doi.org/10.1007/s11665-020-04632-0
[4] R. Goldstein, T. Eddir, E. Buchner, R. Cryderman, A. Banka, and A. Senita, “Modeling of Temperature Gradients During Short Time Dilatometry Testing,” Journal of Materials Engineering and Performance, ASM International, 2020, doi.org/10.1007/s11665-020-04862-2.
If you have more questions, require service or just need general information, we are here to help.
Our knowledgeable Customer Service team is available during business hours to answer your questions in regard to Fluxtrol product, pricing, ordering and other information. If you have technical questions about induction heating, material properties, our engineering and educational services, please contact our experts by phone, e-mail or mail.
Fluxtrol Inc.
1388 Atlantic Boulevard,
Auburn Hills, MI 48326
Telephone: +1-800-224-5522
Outside USA: 1-248-393-2000
FAX: +1-248-393-0277